watonomous.github.io
[ Electrical Division : System Monitoring (2020) ]
Created by [ Charlie Lew], last modified by [ Avery Chiu] on Feb 06, 2021
Previous Development
[The ideal way to display real time stats was to use the TICK (Telegraf, InfluxDB, Chronograf, Kapacitor) stack for this task. Telegraf is used for data aggregation. InfluxDB for data storage. Chronograf for data visualization and Kapacitor for notifications. With limited amount of time, this stack was ideal for the task. It allowed us to leverage existing technology and Chronograf can refresh every 5 seconds which was fast enough for our use cases thus eliminating the need for socket programming. We will now go into depth about each element of the stack and show how it is setup for the Rugged.]
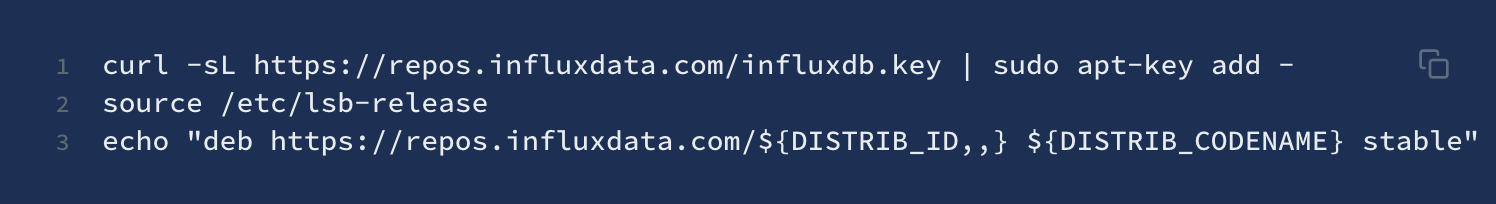
[Add Influx Data Key]
[In order to be able to sudo apt install influxdb or
any other applications in the stack, we must first add the InfluxData
repository source to the sources.list.d . Skip the
second command if you are running Ubuntu 16.04 as there is no
/etc/lsb-release
file.]
[[ {.confluence-embedded-image
width=”500”}]{.confluence-embedded-file-wrapper
.confluence-embedded-manual-size}]
{.confluence-embedded-image
width=”500”}]{.confluence-embedded-file-wrapper
.confluence-embedded-manual-size}]
[With the new sources in place we need to update the package list. ]
[[ {.confluence-embedded-image
width=”500”}]{.confluence-embedded-file-wrapper
.confluence-embedded-manual-size}]
{.confluence-embedded-image
width=”500”}]{.confluence-embedded-file-wrapper
.confluence-embedded-manual-size}]
[Now we can install everything in the TICK stack.]
[InfluxDB]
[InfluxDB is an open-source time series database. It is written in Go and optimized for fast, high-availability storage and retrieval of time series data in fields such as operations monitoring, application metrics, sensor data and real-time analytics. InfluxDB uses a SQL like querying language.]
[To install InfluxDB]
[[ {.confluence-embedded-image
width=”500”}]{.confluence-embedded-file-wrapper
.confluence-embedded-manual-size}]
{.confluence-embedded-image
width=”500”}]{.confluence-embedded-file-wrapper
.confluence-embedded-manual-size}]
[After installation is complete start influxdb as a service. We are
going to be using the default configuration file which is located at
/etc/influxdb/influxdb.conf
.]
[[ {.confluence-embedded-image
width=”500”}]{.confluence-embedded-file-wrapper
.confluence-embedded-manual-size}]
{.confluence-embedded-image
width=”500”}]{.confluence-embedded-file-wrapper
.confluence-embedded-manual-size}]
[Check the status to ensure that influxdb is running. It will be using port 8086.]
[[ {.confluence-embedded-image
width=”500”}]{.confluence-embedded-file-wrapper
.confluence-embedded-manual-size}]
{.confluence-embedded-image
width=”500”}]{.confluence-embedded-file-wrapper
.confluence-embedded-manual-size}]
[Note: Alternatively you can run influxdb manually using
influxd in the terminal. However, if you plan on
switching back to running it as a service, I would not recommend running
influxd as it messes with the installation path of
where the database and files are initialized. To revert back to be able
to use it as a service and will require some file manipulation to get
the influxdb service started again.
]
[We can now connect to the influxdb instance with the following command:]
[[ {.confluence-embedded-image
width=”500”}]{.confluence-embedded-file-wrapper
.confluence-embedded-manual-size}]
{.confluence-embedded-image
width=”500”}]{.confluence-embedded-file-wrapper
.confluence-embedded-manual-size}]
[Telegraf]
[Telegraf is an agent written in Go for collecting performance metrics from the system it's running on and the services running on that system. The collected metrics are output to InfluxDB or or other supported data stores.]
[Install telegraf]
[[ {.confluence-embedded-image
width=”500”}]{.confluence-embedded-file-wrapper
.confluence-embedded-manual-size}]
{.confluence-embedded-image
width=”500”}]{.confluence-embedded-file-wrapper
.confluence-embedded-manual-size}]
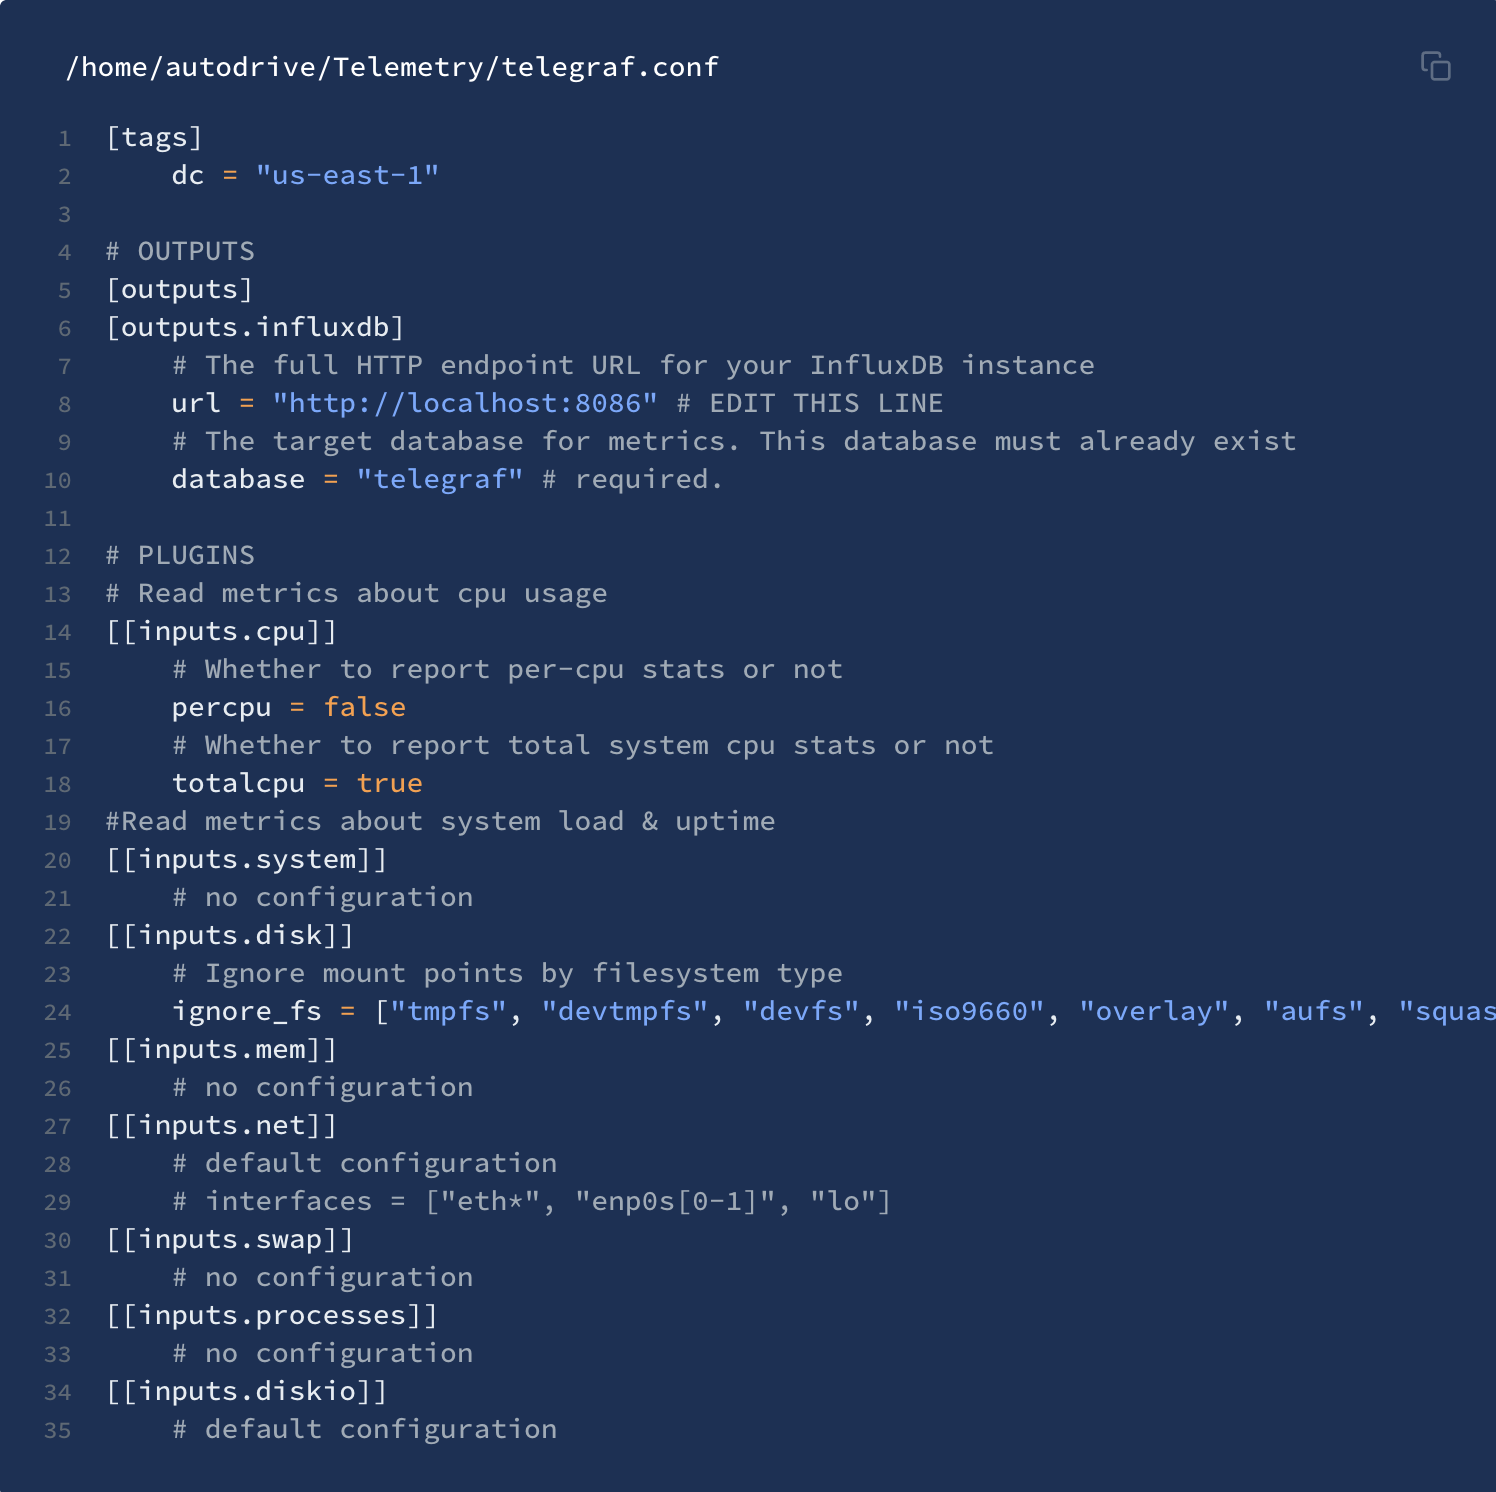
[For telegraf we don't use the default configuration file, so we create
our own telegraf file
at/home/autodrive/Telemetry/telegraf.conf
[[ {.confluence-embedded-image
width=”500”}]{.confluence-embedded-file-wrapper
.confluence-embedded-manual-size}]
{.confluence-embedded-image
width=”500”}]{.confluence-embedded-file-wrapper
.confluence-embedded-manual-size}]
[This configuration file aggregates all cpu and system data for the
rugged, however, it is consistently updated with more plugins when more
information is required. More plugins can be explored here:
https://docs.influxdata.com/telegraf/v1.12/plugins/plugin-list/
and you can view the usage with
telegraf -usage plugin-name
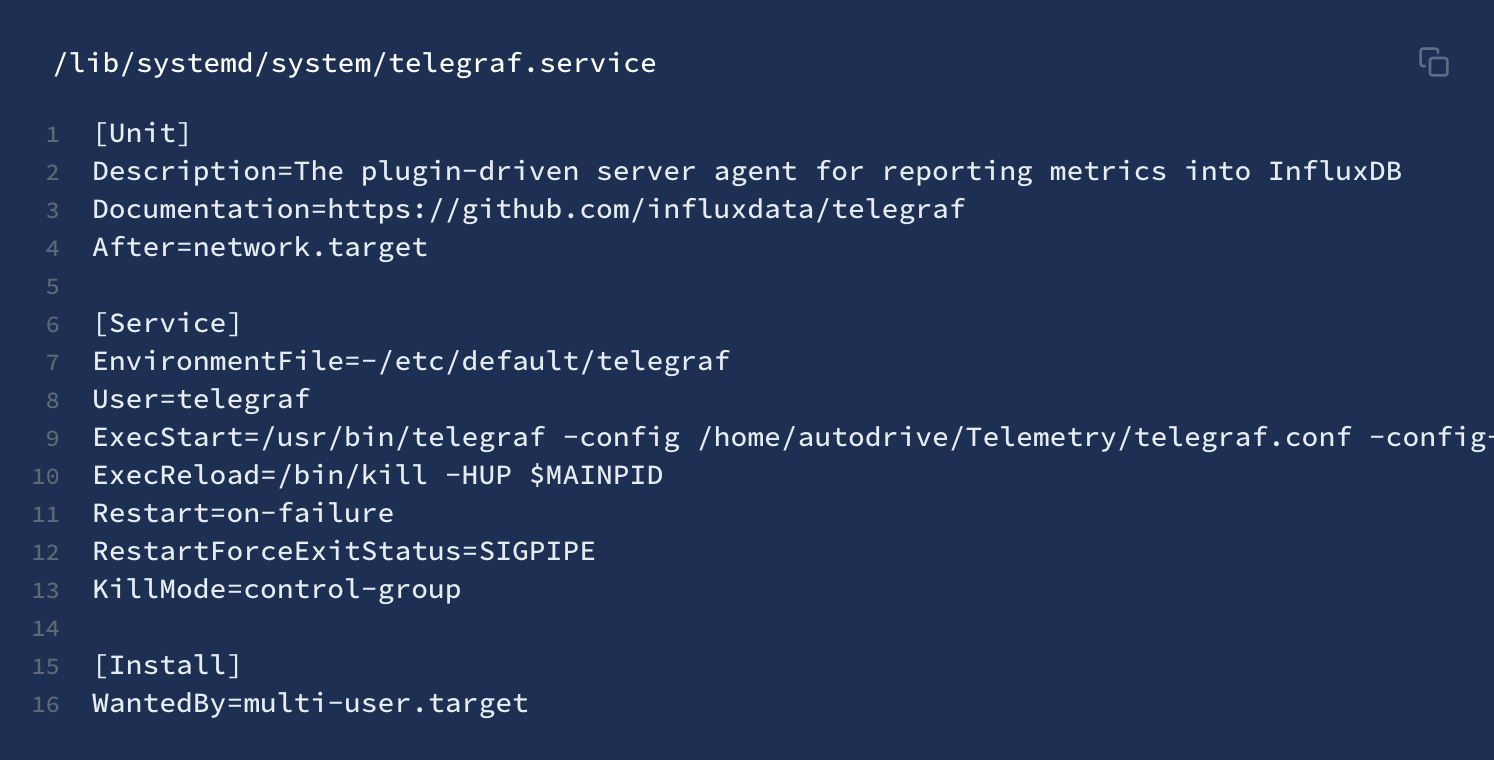
[Now, before starting the service we need to modify the telegraf service file as we aren't using the defalt config file.]
[ {.confluence-embedded-image
height=”250”}]{.confluence-embedded-file-wrapper
.confluence-embedded-manual-size}
{.confluence-embedded-image
height=”250”}]{.confluence-embedded-file-wrapper
.confluence-embedded-manual-size}
[We can now start the service]
[[ {.confluence-embedded-image
width=”500”}]{.confluence-embedded-file-wrapper
.confluence-embedded-manual-size}]
{.confluence-embedded-image
width=”500”}]{.confluence-embedded-file-wrapper
.confluence-embedded-manual-size}]
[Confirm that the service is running with]
[[ {.confluence-embedded-image
width=”500”}]{.confluence-embedded-file-wrapper
.confluence-embedded-manual-size}]
{.confluence-embedded-image
width=”500”}]{.confluence-embedded-file-wrapper
.confluence-embedded-manual-size}]
[Every time the configuration file is changed we run]
[[ {.confluence-embedded-image
width=”500”}]{.confluence-embedded-file-wrapper
.confluence-embedded-manual-size}]
{.confluence-embedded-image
width=”500”}]{.confluence-embedded-file-wrapper
.confluence-embedded-manual-size}]
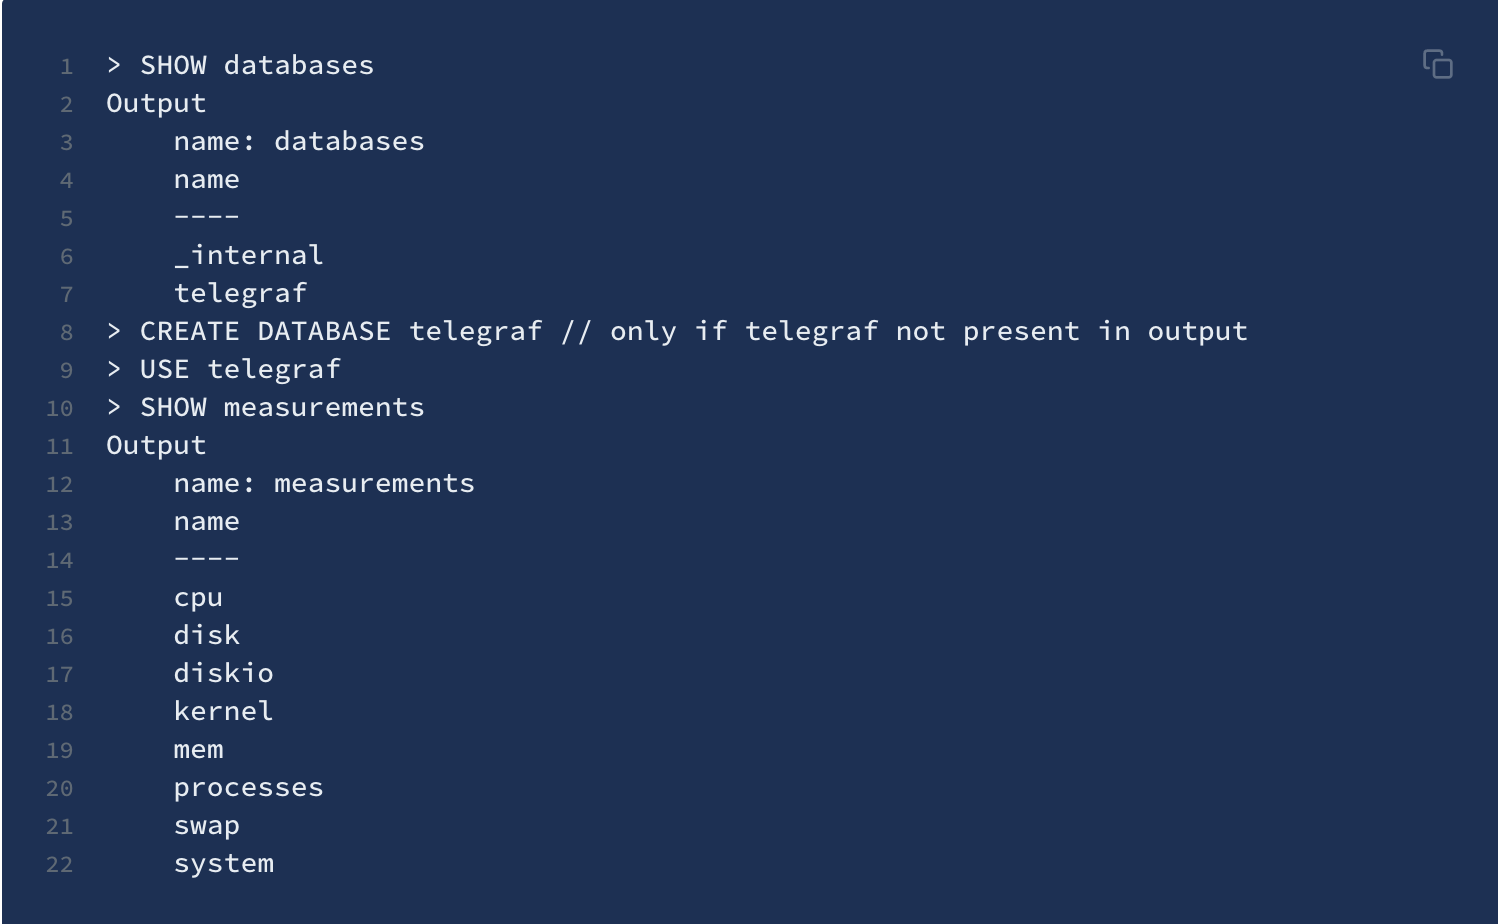
[Now we can connect to influxDB again with influx to
see what measurements are being aggregated and if they are being
aggregated.]
[[ {.confluence-embedded-image
width=”500”}]{.confluence-embedded-file-wrapper
.confluence-embedded-manual-size}]
{.confluence-embedded-image
width=”500”}]{.confluence-embedded-file-wrapper
.confluence-embedded-manual-size}]
[Chronograf]
[Chronograf is a graphing and visualization application that provides tools to visualize monitoring data and create alerting and automation rules. We are now going to connect this to retrieve data from our influxDB instance.]
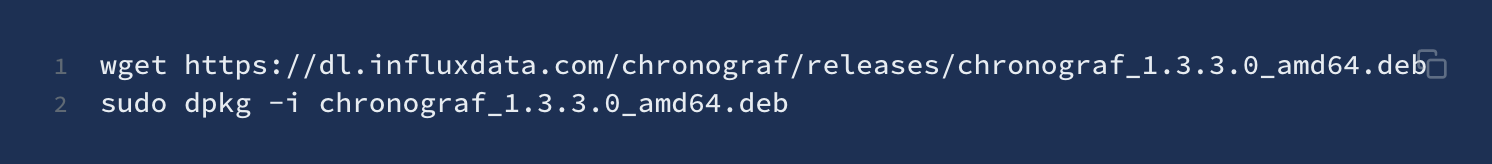
[Install chronograf]
[ {.confluence-embedded-image
width=”500”}]{.confluence-embedded-file-wrapper
.confluence-embedded-manual-size}
{.confluence-embedded-image
width=”500”}]{.confluence-embedded-file-wrapper
.confluence-embedded-manual-size}
[Then start chronograf service]
[[ {.confluence-embedded-image
width=”500”}]{.confluence-embedded-file-wrapper
.confluence-embedded-manual-size}]
{.confluence-embedded-image
width=”500”}]{.confluence-embedded-file-wrapper
.confluence-embedded-manual-size}]
[Then on http://localhost:8888 there will be a menu.
Fill the boxes with their corresponding values. Eg. name of database:
telegraf and connection string
http://localhost:8086
[After that you can access the pre-built system dashboard under host list. Or create your own dashboard using your own queries! (version 1.3.3 of Chronograf newer versions have an updated UI).]
Problem
[[Previously, we were using TICK (Telegraf, InfluxDB, Chronograf and Kapacitor). This allowed us to aggregate data with Telegraf, store it in InfluxDB and display it in Chronograf, but Kapacitor was giving warning notifications. Since the TICK stack implementation was done in linux service that booted up on startup, the functionality of the service is breaking.]
Limitations
Telegraph and influxDB must live in the rugged.
Current Development
Deploy TICK stack as Docker container using the following instructions:
- https://hub.docker.com/_/telegraf/
- https://hub.docker.com/_/influxdb/
- https://hub.docker.com/_/chronograf/
- https://hub.docker.com/_/kapacitor/
What Each Item of the TICK Stack Does
Data is sent to Telegraph, then stored in an InfluxDB database. Chronograf allows to query the database through a nice web interface. Kapacitor can process, monitor, and raise alerts based on the data.
How can we actually view our InfluxDB database and interact with it? Do we ssh into the Docker container to do so? How can we access InfluxDB from outside the vehicle since we need people who are not in the car to see the live data as well?
- We van view our InfluxDB by using it’s built-in UI (port 8888 when Chronograf is active)
- Another option, that gives a holistic view without going into the database as a whole is to use Grafana
- Here is a link to weigh the pro’s and con’s: [[https://www.metricfire.com/blog/grafana-vs-chronograf-and-influxdb/]
How can we send mock data without actually setting up the pipeline?
To send test data, we can:
- curl to send data directly to the influxdb
- expose the UDP port 8125 and send data through that port
- use the statsd plugin
**[How will this whole stack communicate with each other if they are in different Docker containers?]
- Essentially the various services communicate with each other via exposed ports on the server (I’m not too sure if that is production-grade)
- I have heard people online use docker networks to isolate the containers while still allowing them to communicate with one another.
High Level Diagram
Coming soon
Attachments:
![]() image2020-2-13_17-45-22.png
(image/png)
image2020-2-13_17-45-22.png
(image/png)
![]() image2020-2-13_17-46-8.png
(image/png)
image2020-2-13_17-46-8.png
(image/png)
![]() image2020-2-13_17-46-11.png
(image/png)
image2020-2-13_17-46-11.png
(image/png)
![]() image2020-2-13_17-49-8.png
(image/png)
image2020-2-13_17-49-8.png
(image/png)
![]() image2020-2-13_17-49-41.png
(image/png)
image2020-2-13_17-49-41.png
(image/png)
![]() image2020-2-13_17-50-46.png
(image/png)
image2020-2-13_17-50-46.png
(image/png)
![]() image2020-2-13_17-51-22.png
(image/png)
image2020-2-13_17-51-22.png
(image/png)
![]() image2020-2-13_17-52-5.png
(image/png)
image2020-2-13_17-52-5.png
(image/png)
![]() image2020-2-13_17-52-30.png
(image/png)
image2020-2-13_17-52-30.png
(image/png)
![]() image2020-2-13_17-53-17.png
(image/png)
image2020-2-13_17-53-17.png
(image/png)
![]() image2020-2-13_17-53-41.png
(image/png)
image2020-2-13_17-53-41.png
(image/png)
![]() image2020-2-13_17-54-8.png
(image/png)
image2020-2-13_17-54-8.png
(image/png)
![]() image2020-2-13_17-54-31.png
(image/png)
image2020-2-13_17-54-31.png
(image/png)
![]() image2020-2-13_17-55-27.png
(image/png)
image2020-2-13_17-55-27.png
(image/png)
![]() image2020-2-13_17-56-5.png
(image/png)
image2020-2-13_17-56-5.png
(image/png)
![]() image2020-2-13_17-56-29.png
(image/png)\
image2020-2-13_17-56-29.png
(image/png)\
Document generated by Confluence on Nov 28, 2021 22:40