watonomous.github.io
[ Electrical Division : Radar Setup ]
Created by [ Rowan Dempster], last modified by [ Frank Yan] on Apr 24, 2020
Table of Contents
Document Overview
This document will go over how to set-up the live radars from your computer with the physical radars. Check the README.md to learn how to run the live radars, this document will focus on the physical and networking set-up for the live radars.
Single Radar Set-Up
Physical Set-Up
The necessary equipment needed to set up one radar is:
- One ARS430 Radar
- One or two Ethernet cables
- DC/DC Power Supply
- BroadR-Reach Media Converter
Ethernet Adapter
[]{.aui-icon .aui-icon-small .aui-iconfont-warning .confluence-information-macro-icon}
If your computer does not have an Ethernet port, get an Ethernet adapter for whatever ports your computer does support.
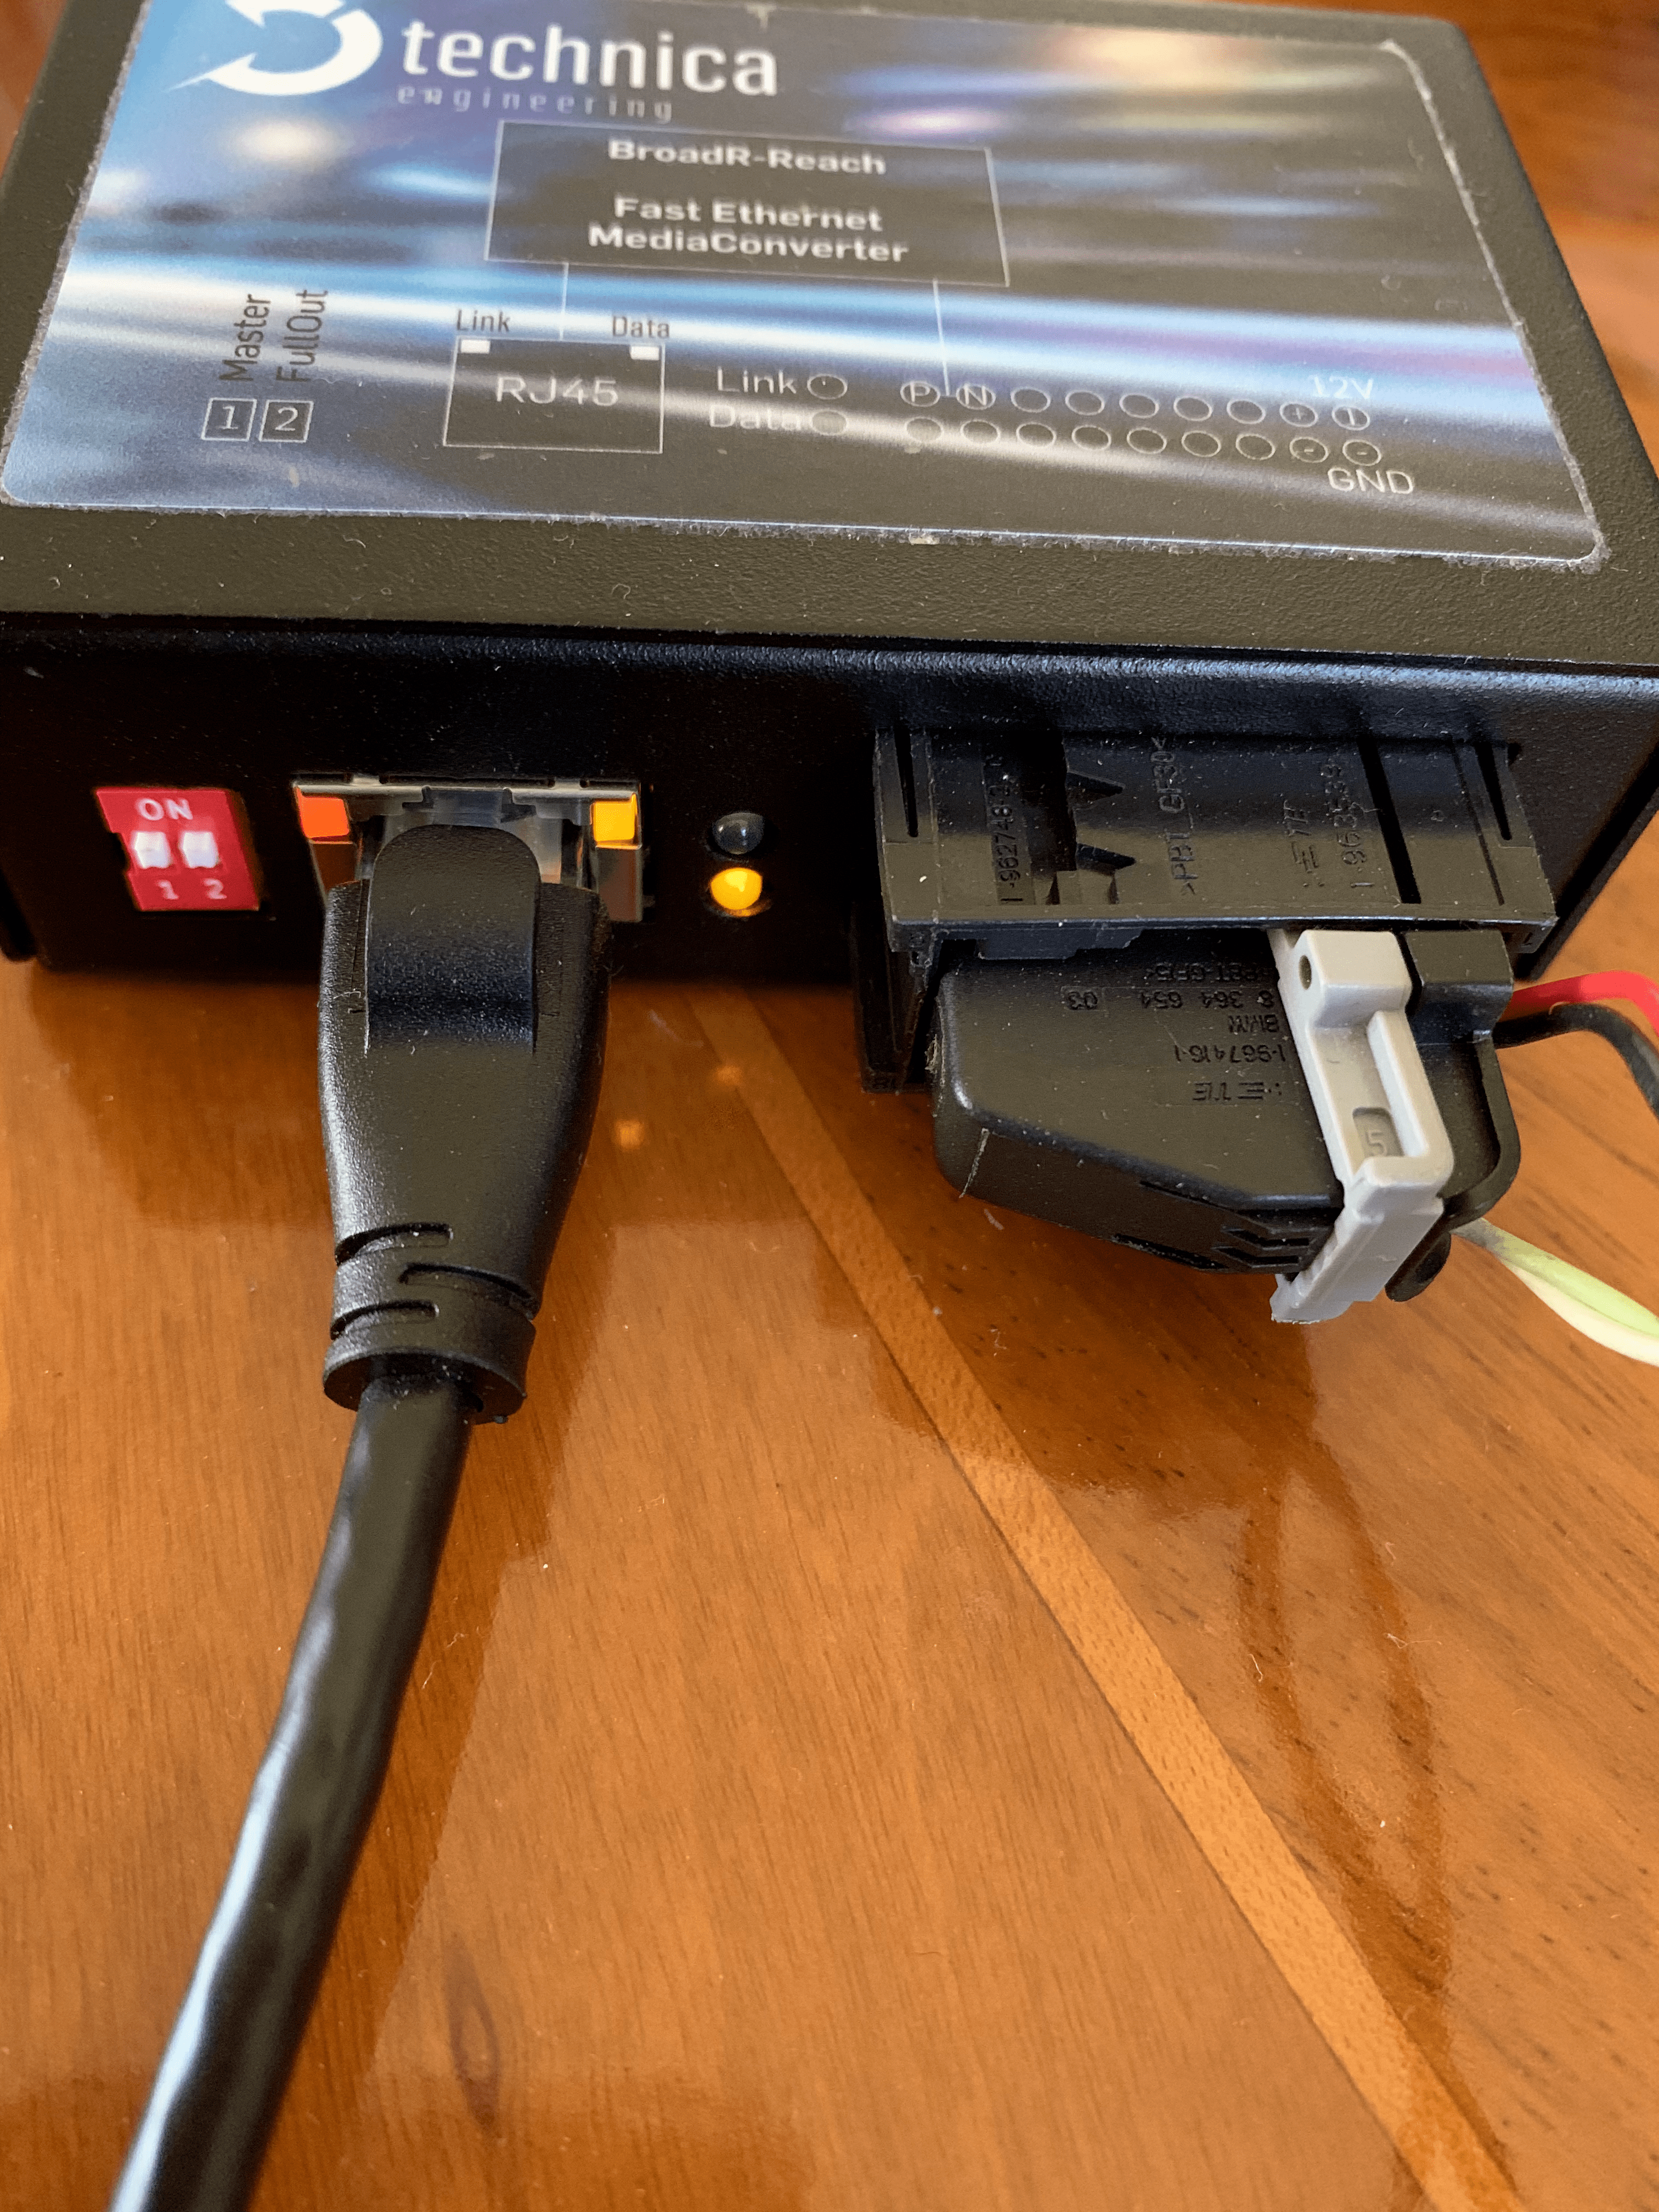
To setup the Continental ARS430 radars for use they must be attached to the BroadR-Reach Media Converter. This is an ethernet box that will convert the signals from the radar into UDP packets we can get. The radar is wired to the ethernet box with 1 power, 1 ground, 1 Rx and 1 Tx connections (presumably).
[ {.confluence-embedded-image
width=”188” height=”250”}]{.confluence-embedded-file-wrapper
.confluence-embedded-manual-size}
{.confluence-embedded-image
width=”188” height=”250”}]{.confluence-embedded-file-wrapper
.confluence-embedded-manual-size}
The ethernet box is then connected via ethernet to whatever switch/computer you want to use it on.
[ {.confluence-embedded-image
.confluence-thumbnail height=”250”}]{.confluence-embedded-file-wrapper
.confluence-embedded-manual-size}
{.confluence-embedded-image
.confluence-thumbnail height=”250”}]{.confluence-embedded-file-wrapper
.confluence-embedded-manual-size}
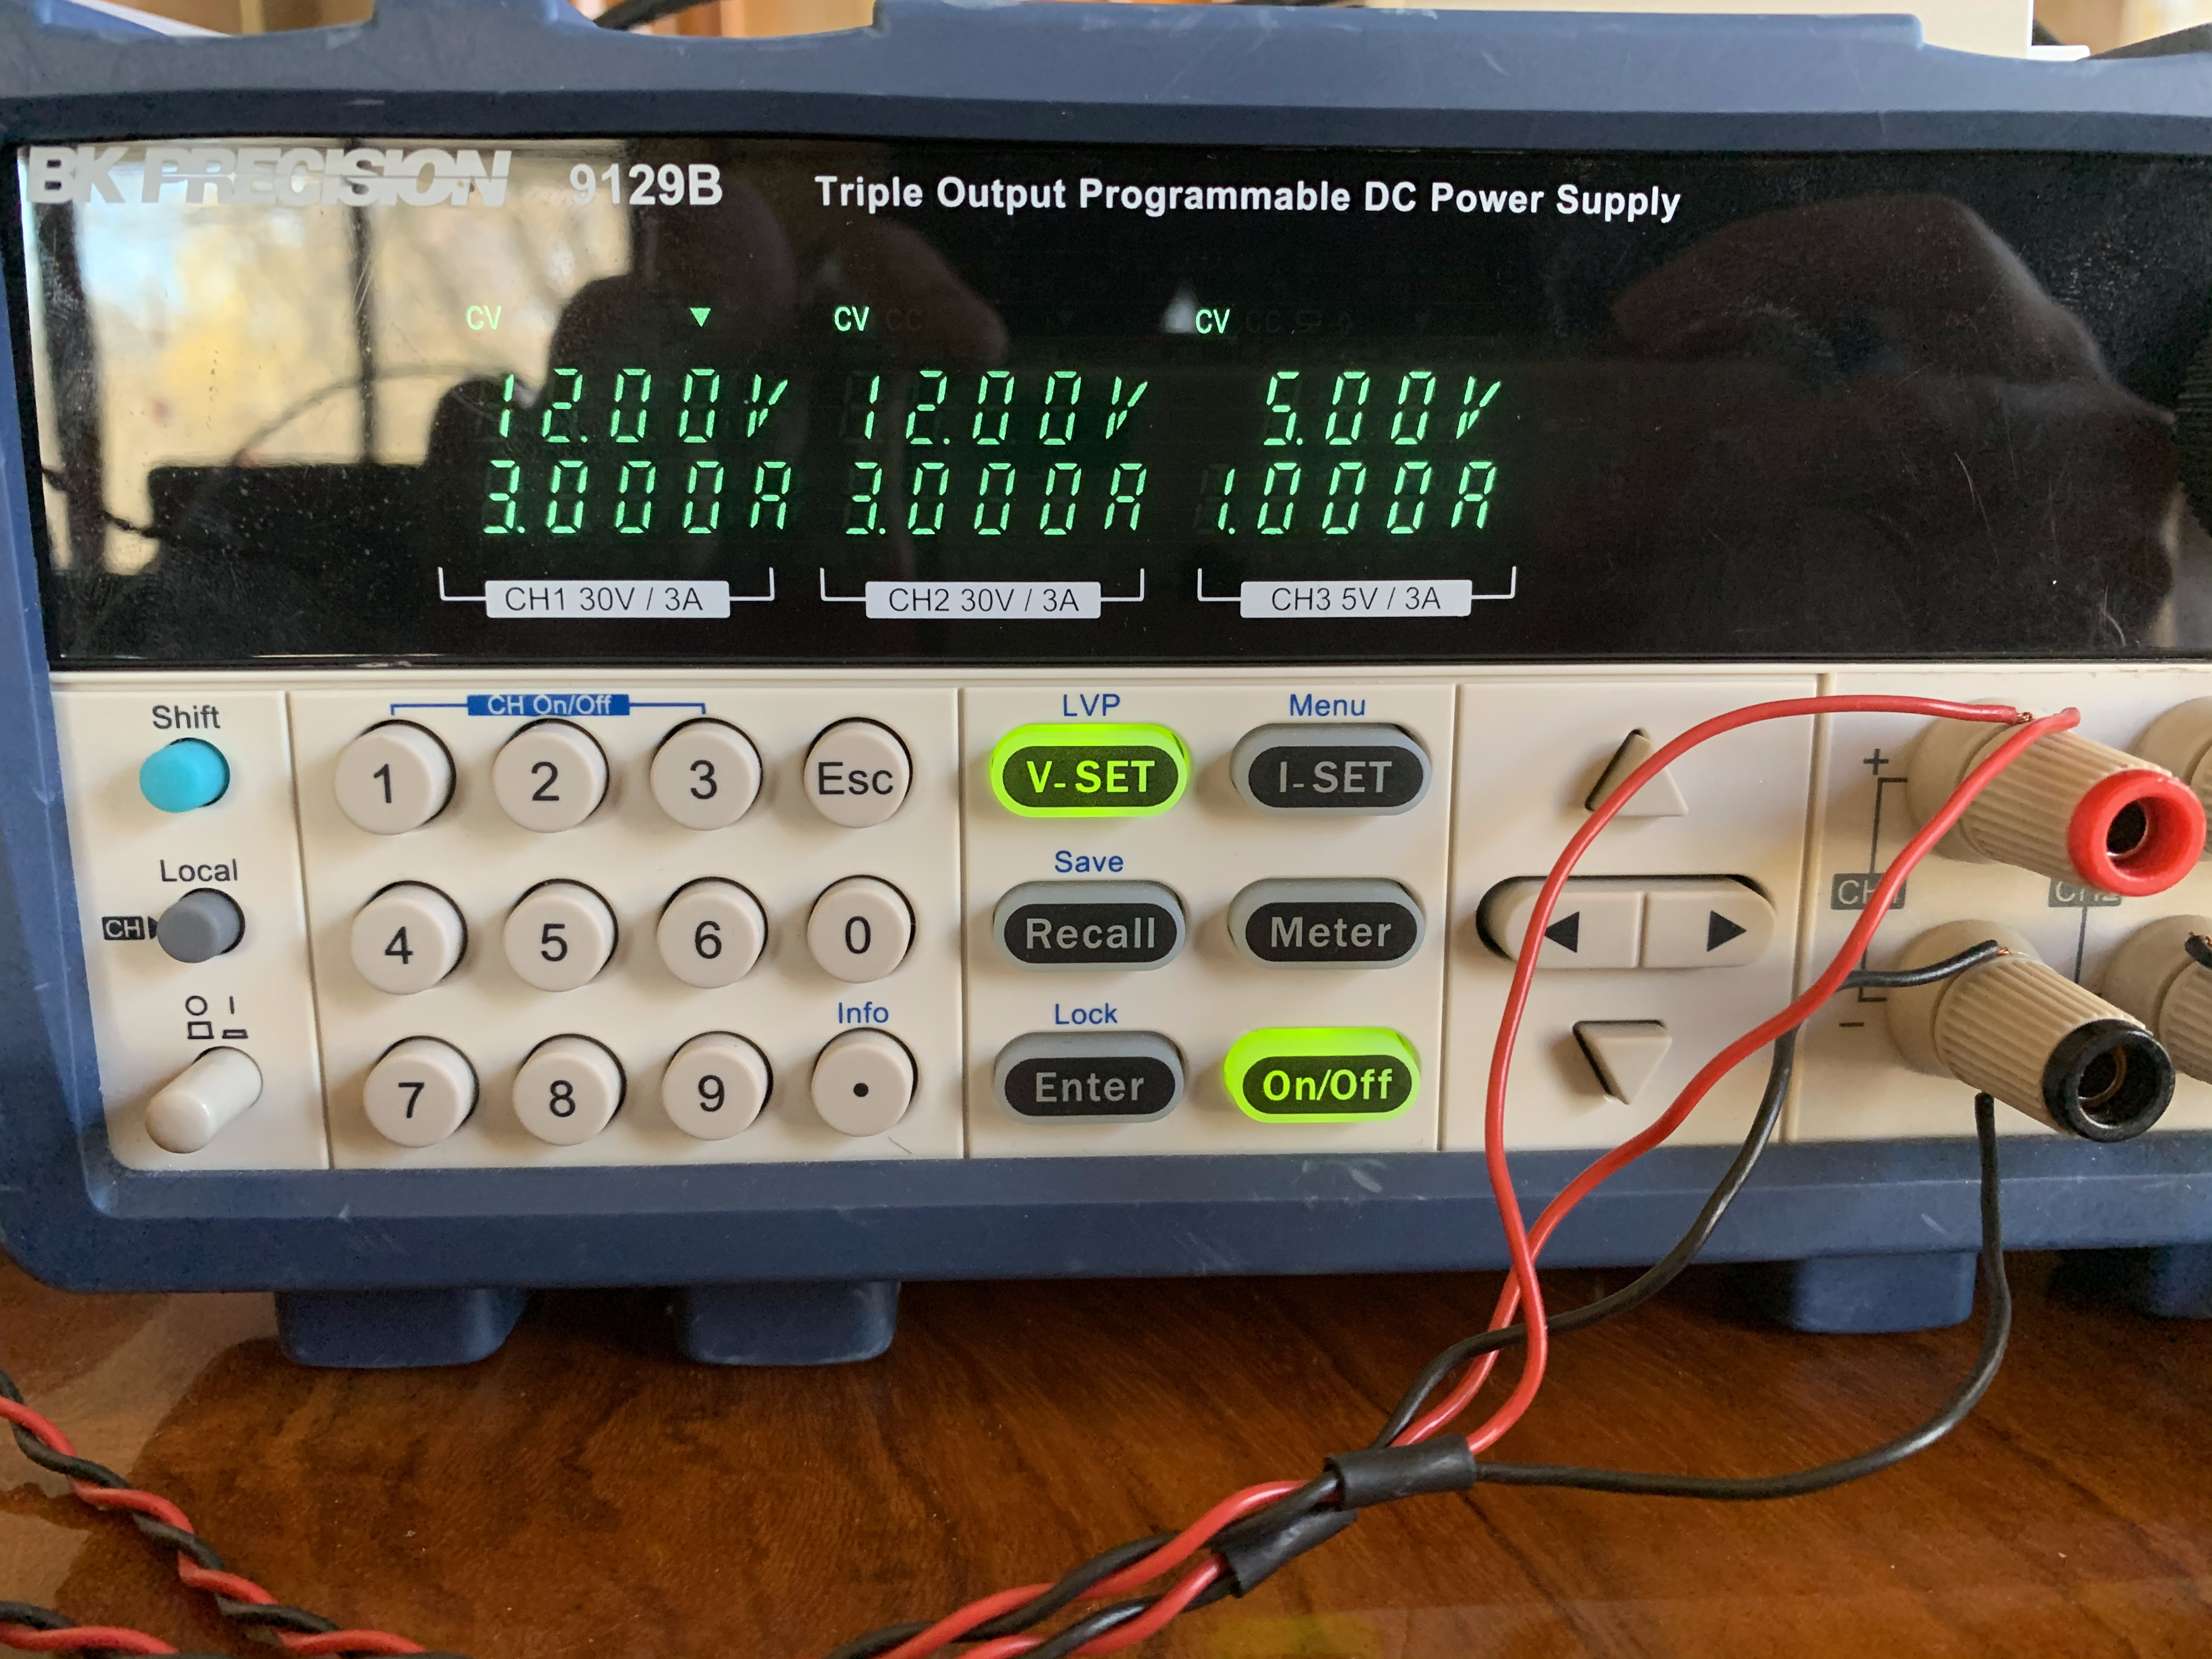
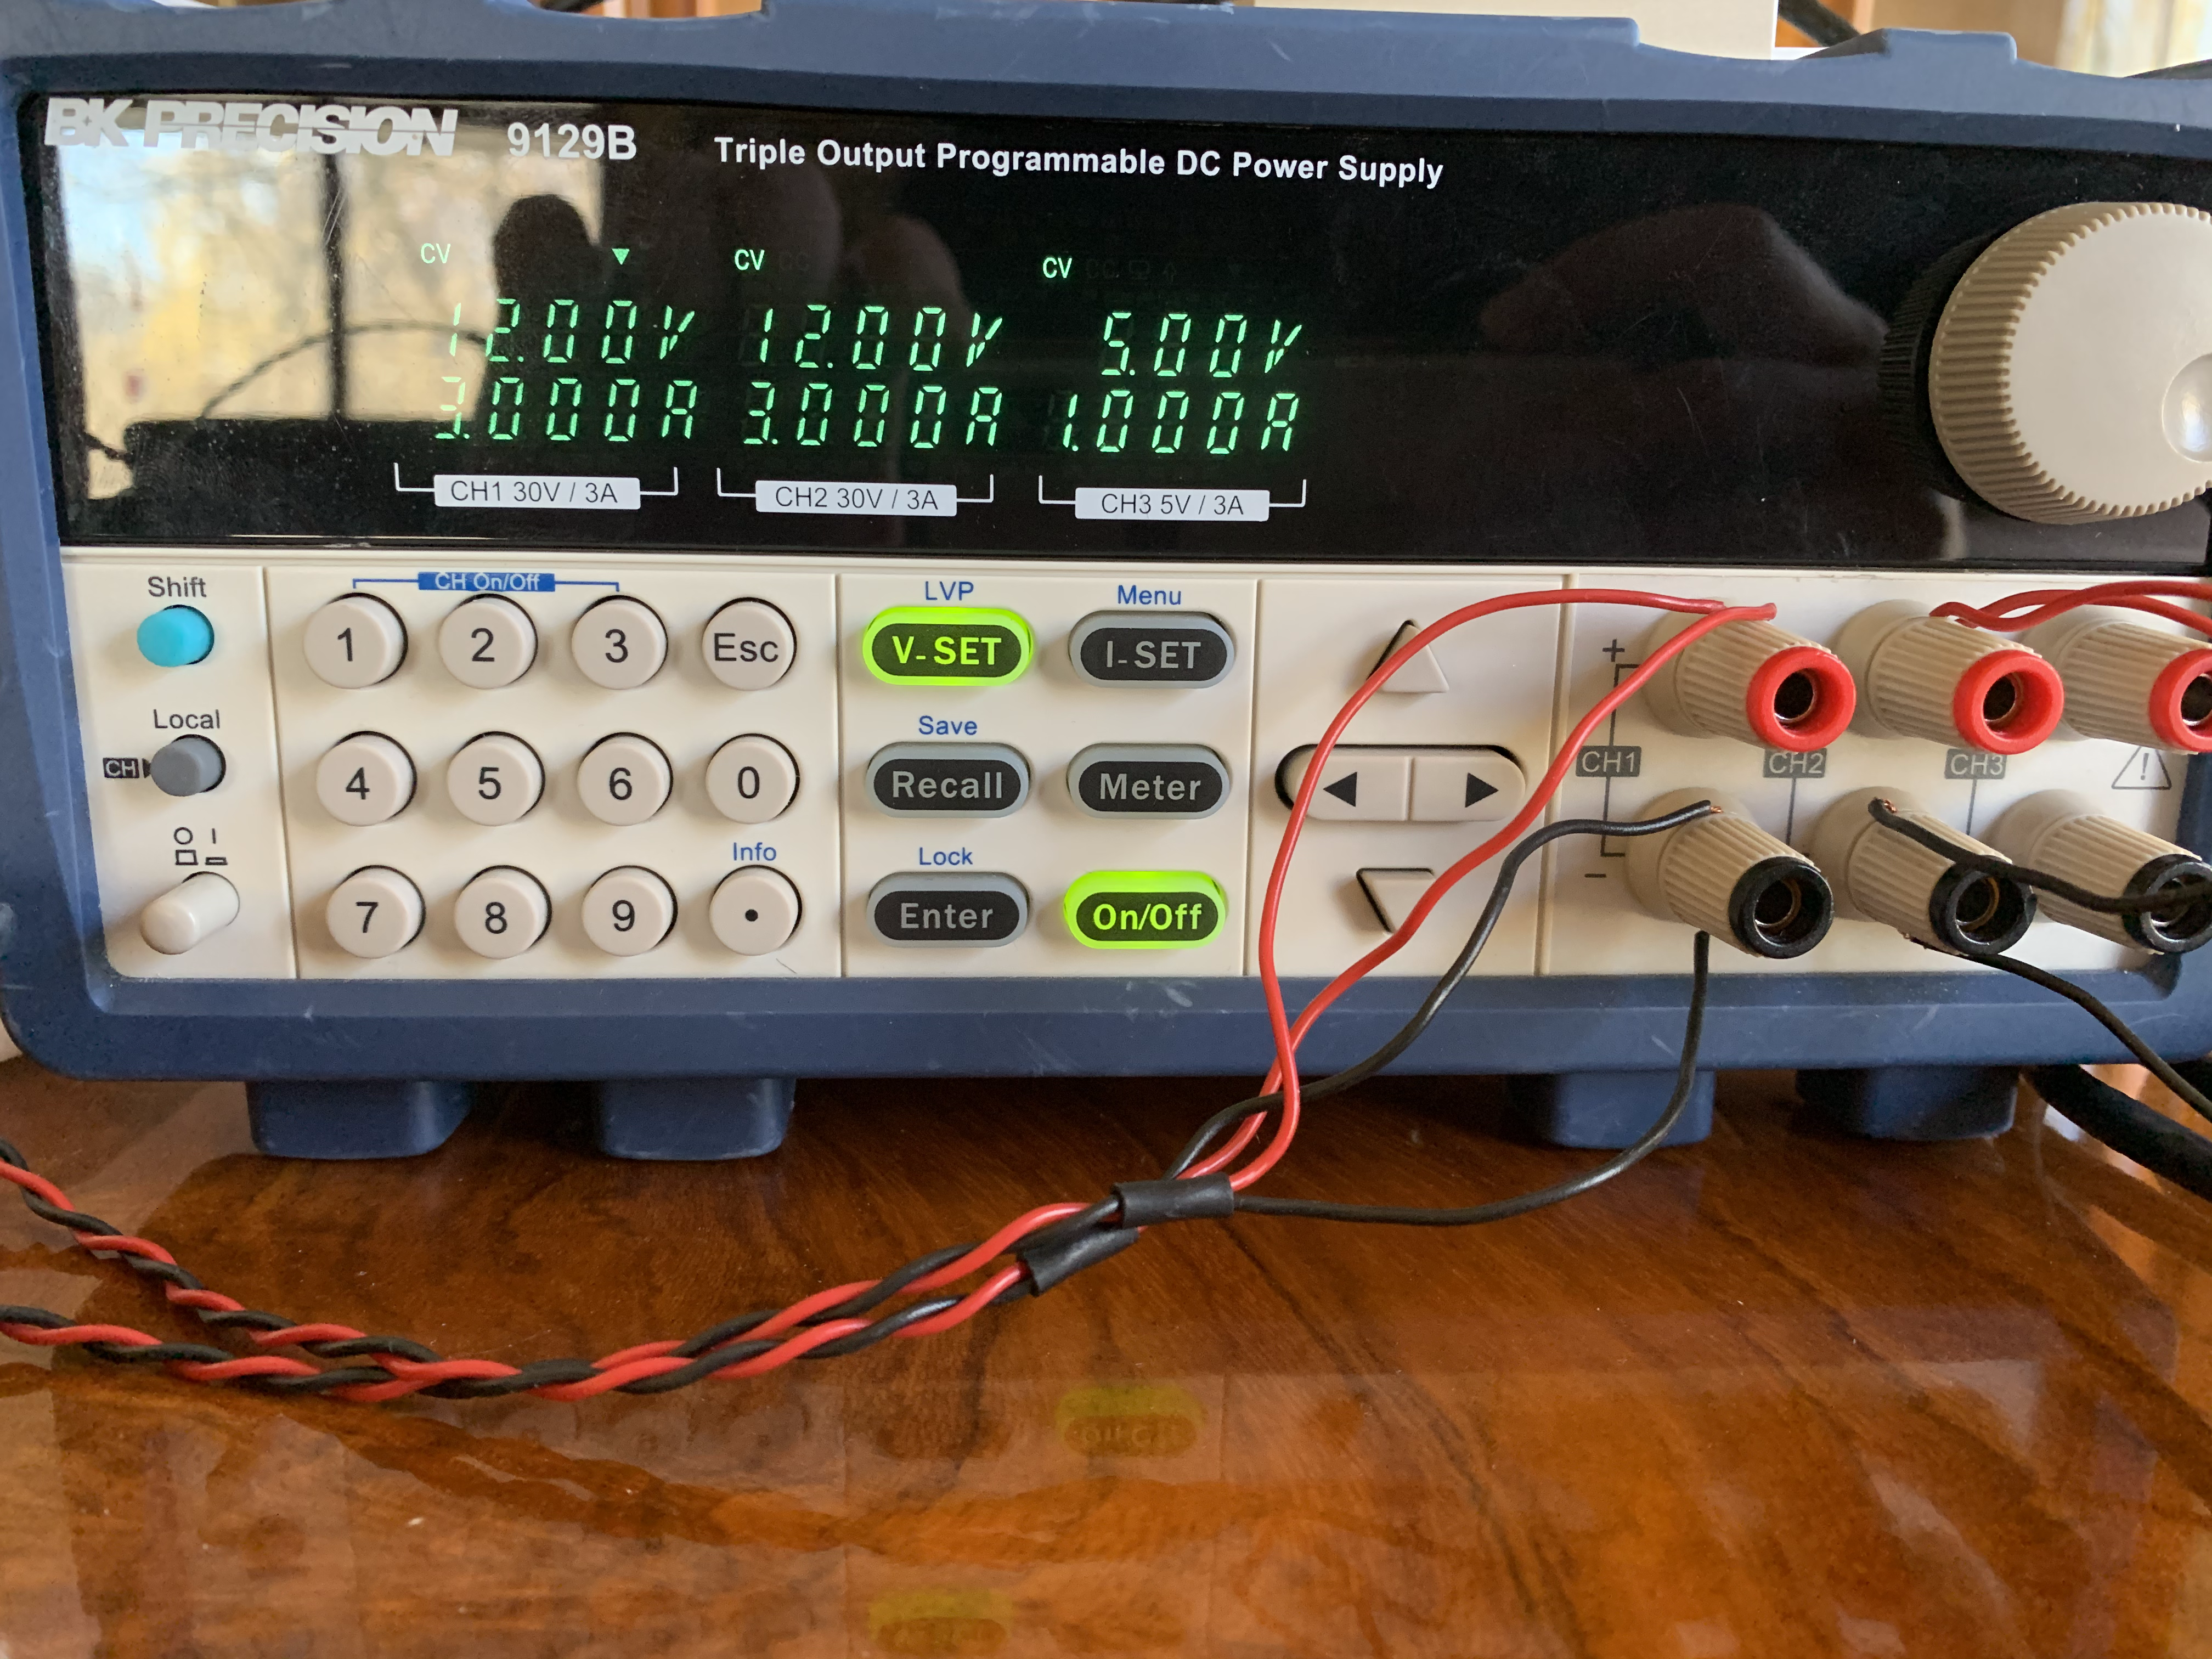
The specifics of the wiring is available in the relevant data sheets. The radars are currently powered from a 12V supply box with a 3A limit set.
[ {.confluence-embedded-image
height=”250”}]{.confluence-embedded-file-wrapper
.confluence-embedded-manual-size}
{.confluence-embedded-image
height=”250”}]{.confluence-embedded-file-wrapper
.confluence-embedded-manual-size}
Make sure both pair of wires from the radar are connected to the DC power supply. Red wires are for the positive terminal and the black wires are for the negative terminal. Do not make any adjustments to the radar's wiring while the power supply is on, turn off the power supply if you need to adjust or remove the wires from the power supply. Once everything is set up, turn on the power supply by pressing the white cylinder as seen in the bottom left corner of the above picture and press the On/Off button. If everything is done correctly then the box should show flashing lights as seen as such:
[ {.confluence-embedded-image
.confluence-thumbnail height=”250”}]{.confluence-embedded-file-wrapper
.confluence-embedded-manual-size}
{.confluence-embedded-image
.confluence-thumbnail height=”250”}]{.confluence-embedded-file-wrapper
.confluence-embedded-manual-size}
The physical set-up of the radar is now done, make sure the radar is facing the direction you want to use it in. the metal side of the radar is the back and the front of the radar is the side with all the writing and symbols.
[ {.confluence-embedded-image
.confluence-thumbnail height=”250”}]{.confluence-embedded-file-wrapper
.confluence-embedded-manual-size}
{.confluence-embedded-image
.confluence-thumbnail height=”250”}]{.confluence-embedded-file-wrapper
.confluence-embedded-manual-size}
Network Configurations
To receive the UDP packets, the relevant network settings must be configured. Depending on if you have a switch available, or if your computer has an ethernet port, there are different steps you must follow to make sure the radars are configured under the right network. Read the section(s) that best suits your set-up and equipment.
My computer has an Ethernet port and I have a switch
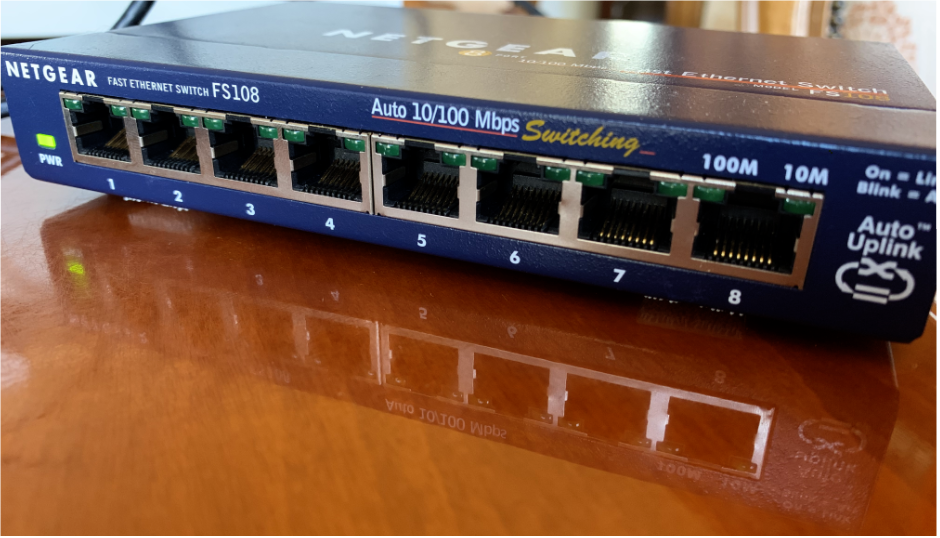
If your computer has an Ethernet port and you have a switch available such as a switch similar to the one pictured below, then connect an Ethernet cable to your computer to the switch and connect the Ethernet cable from the radar's Ethernet box to any of the switch's available ports.
[ {.confluence-embedded-image
height=”250”}]{.confluence-embedded-file-wrapper
.confluence-embedded-manual-size}
{.confluence-embedded-image
height=”250”}]{.confluence-embedded-file-wrapper
.confluence-embedded-manual-size}
That is all that needs to be done if you have this configuration, you should not have to change anything. (Not 100% sure of this, just how it's behaving so far).
You can now look at how to run a single radar in the README.md file.
My computer has an Ethernet port but I don't have/am not using a switch
If the radar is connected directly to your computer (not through a multi-port switch) you will need to edit your network settings.
Open up your computer's settings for the relevant wired (Ethernet) connection. Go to IPv4 settings. The following setup was done on Ubuntu, some initial testing showed that this worked automatically on Windows. The wired connections settings are found in System Settings->Network->Wired->Options (bottom right)->IPv4 Settings.
Change the Method drop down menu from Automatic (DHCP) to Manual. Then click Add and enter the following data:
IP: 192.168.137.24
Net-mask: 24
Gateway can be left blank. This will hardcode that wired connection to
those parameters, as the radars do not support DHCP (dynamically
allocating them itself).
[If you would like to test this further to make sure it works, look at the Debugging Tips section for networking tips. ]
[You can now look at how to run a single radar in the ][ file.]
I neither have a switch nor an Ethernet port for my computer
If this is your situation, your first step would be to order an Ethernet adapter for whatever ports your computer supports. Make sure you get one that works with Linux, here is a link for a USB to Ethernet adapter that works well: https://www.amazon.ca/Anker-Unibody-Aluminum-Ethernet-Supporting/dp/B00PC0H9IE/ref=sr_1_14?keywords=usb+to+ethernet+adaptor+linux&qid=1586188395&sr=8-14
If you are using a virtual machine, when you initially connect the adapter make sure you set-up the adapter under the OS you are using to launch the radars. Every step from this point forward will be the same as the steps outlined in the "My computer has an ethernet port but I don't have/am not using a switch" section. Look at that section and you should be good to go from there.
Adapter Issues
[]{.aui-icon .aui-icon-small .aui-iconfont-warning .confluence-information-macro-icon}
You may have to configure the adapter's firmware if the adapter does not automatically receive the radar's packet. Here is a tutorial for setting up a USB to Ethernet adapter in Linux: https://unix.stackexchange.com/questions/386162/how-to-set-up-an-usb-ethernet-interface-in-linux
I have a switch but not an Ethernet port for my computer
This situation is similar to the above situation where your first step would be buying an Ethernet adapter for whatever ports your computer supports. You may still need to configure the adapter's firmware as mentioned in the info box in the above section. The good thing with this set-up is that it follows the same steps as the "My computer has an Ethernet port and I have a switch" section once you make sure your adapter works.
That should be all of the steps needed to set-up one radar. If they are any missing steps or clarification needed, feel free to add in the appropriate information. If you have any questions or are having issues, feel free to ask the radar_driver group on Discord.
Multi-Radar Set-Up
Physical Set-Up
The necessary equipment needed to set up the multi-radars is:
- Two ARS430 Radars
- Three Ethernet cables
- DC/DC Power Supply
- Two BroadR-Reach Media Converter
- One Ethernet Switch
- Measuring tape
What if I don't have a switch?
Unless your computer has two Ethernet ports then you may have trouble with the multi-radar set-up. If your computer has one Ethernet port, you could try getting an Ethernet adapter for whatever ports your computer has and try setting up the multi-radar once you configure the adapter. The worst case would be having no Ethernet ports and using two Ethernet adapters. This could mean that you have to set the firmware for both adapters and do some next level networking. If someone gets any of these situations working, please document the steps that you did to get it working under the "Network Configurations" section on this page.
The multi-radar has similar steps for the single radar physical set-up but keep in mind there are two radars you need to set up. You still need to connect the Ethernet boxes to the radars and set up the power supply connection. Use the second channel with the same settings as the first one for the second radar when connecting it to the power supply.
[ {.confluence-embedded-image
height=”250”}]{.confluence-embedded-file-wrapper
.confluence-embedded-manual-size}
{.confluence-embedded-image
height=”250”}]{.confluence-embedded-file-wrapper
.confluence-embedded-manual-size}
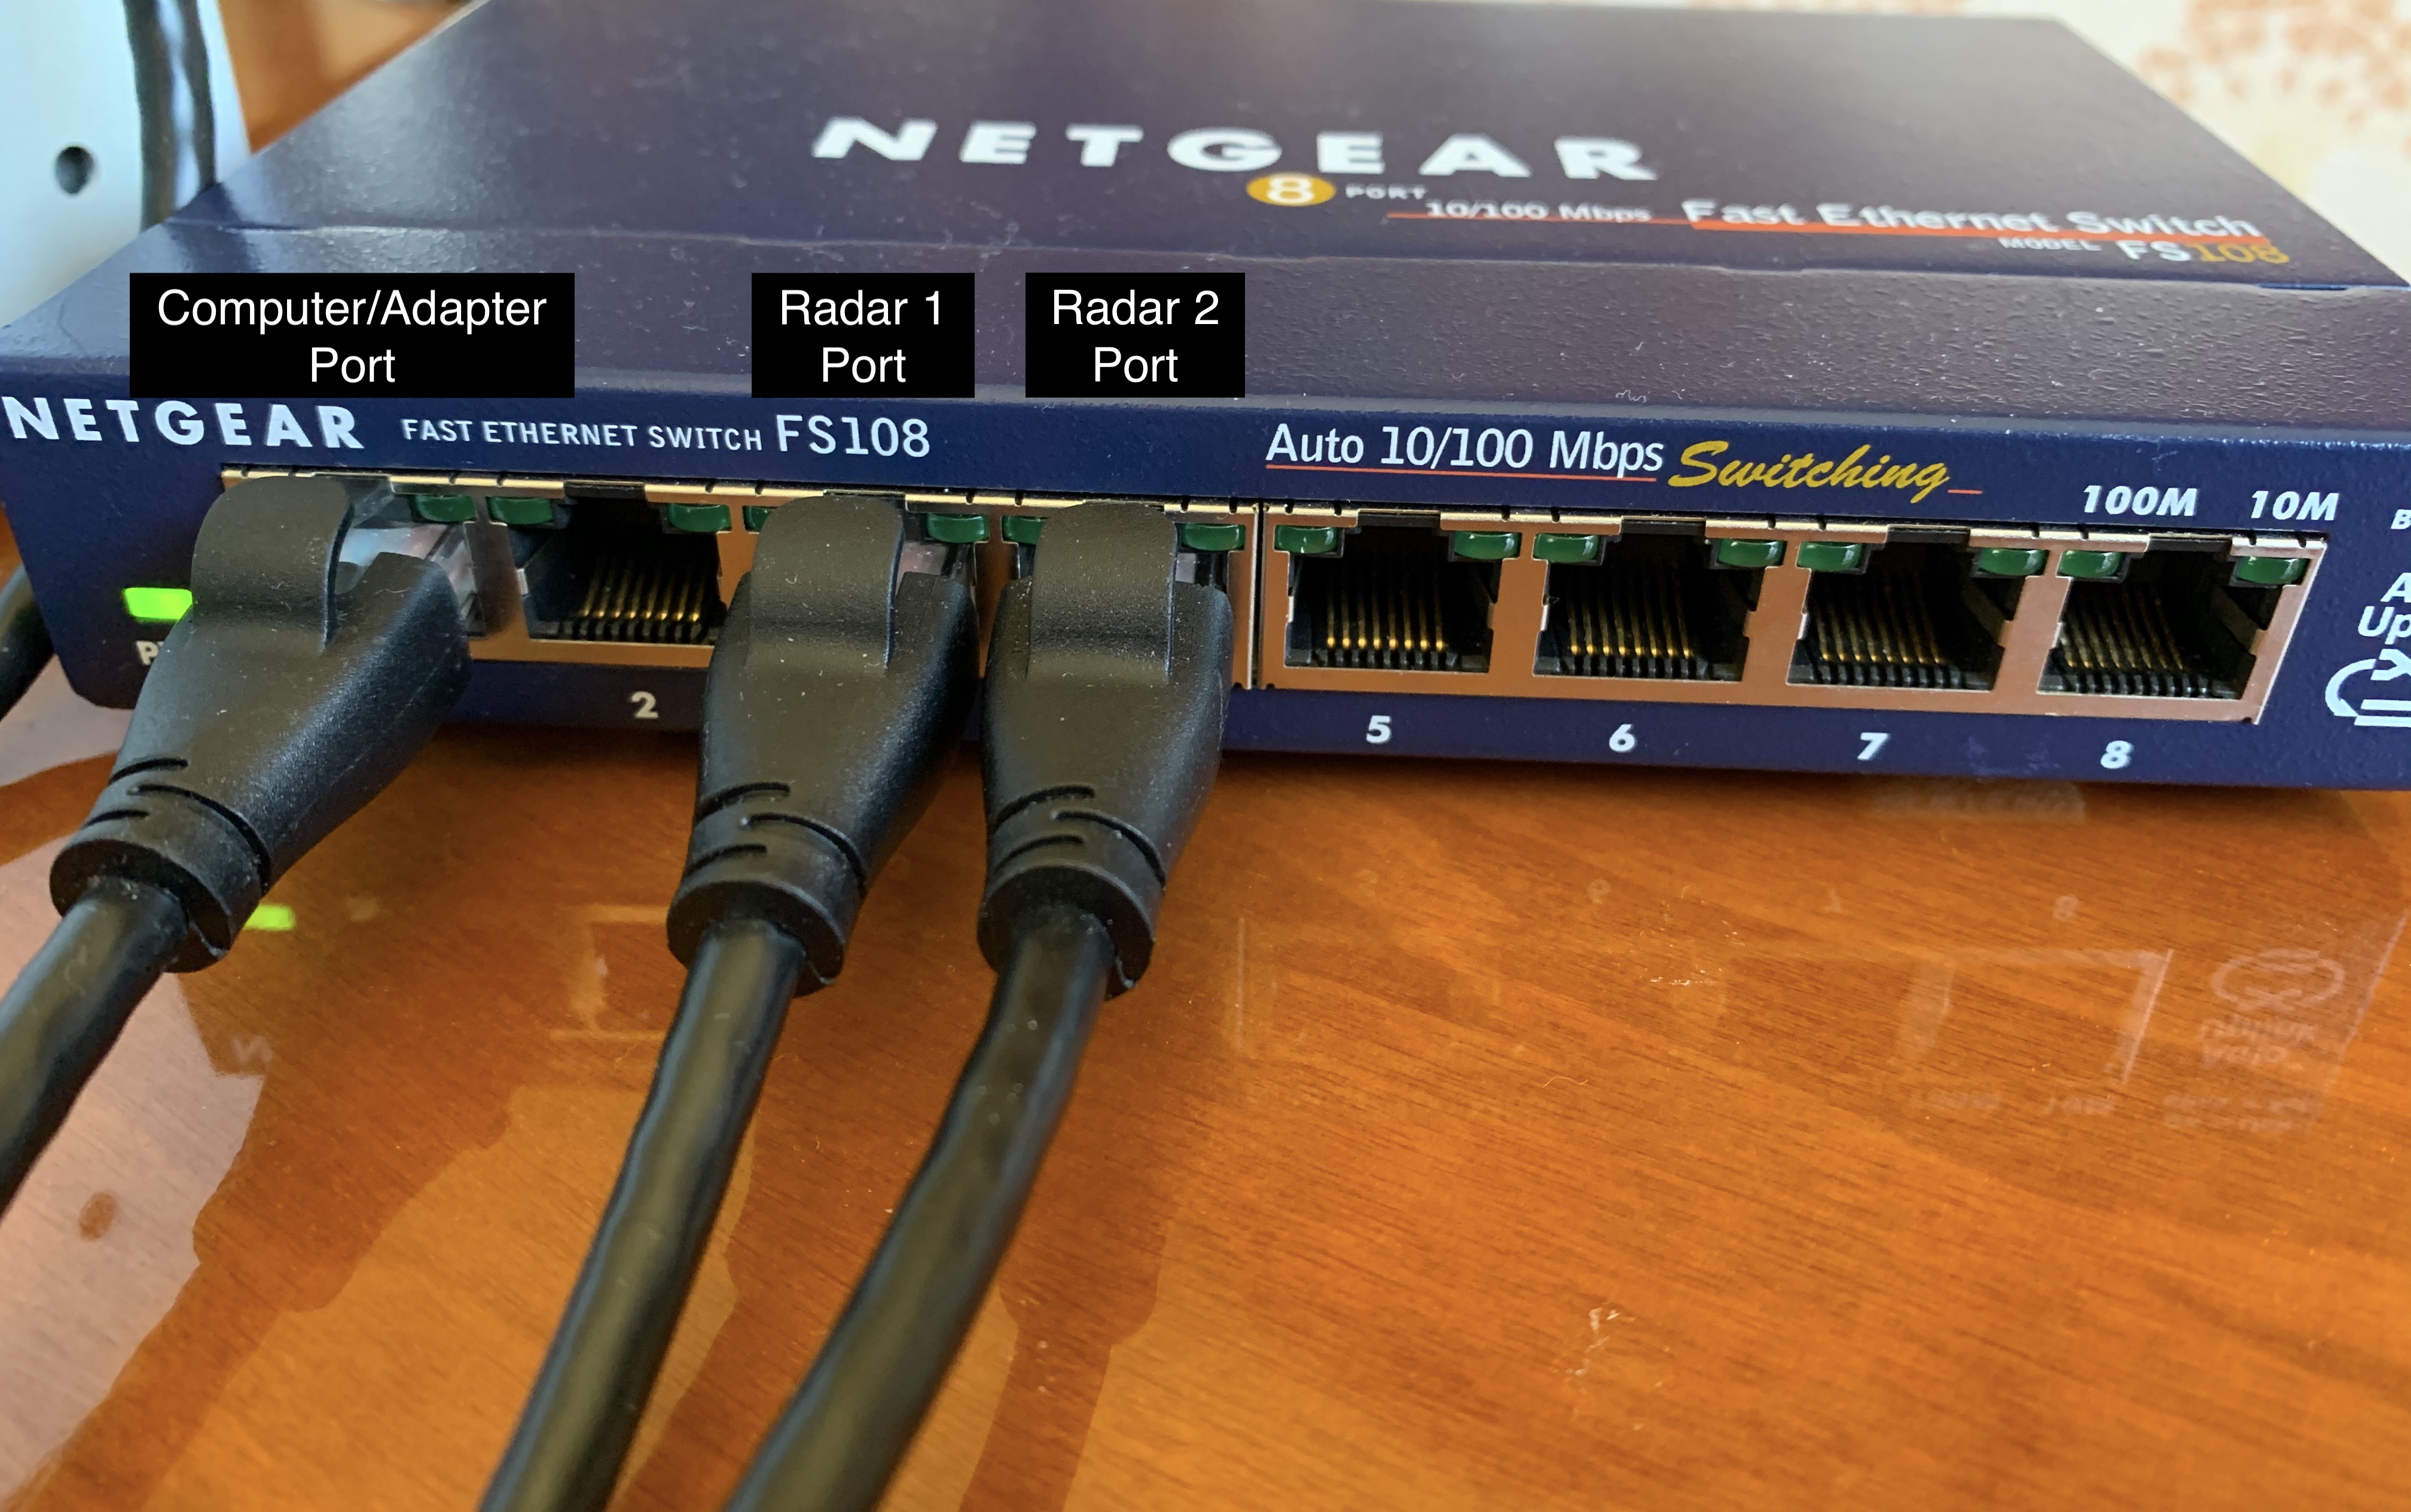
For the switch, connect the Ethernet cables from the Ethernet boxes of each radar to the switch and one cable from your computer/adapter to one of the ports. The port location does not matter so place the cables wherever you want.
[ {.confluence-embedded-image
height=”250”}]{.confluence-embedded-file-wrapper
.confluence-embedded-manual-size}
{.confluence-embedded-image
height=”250”}]{.confluence-embedded-file-wrapper
.confluence-embedded-manual-size}
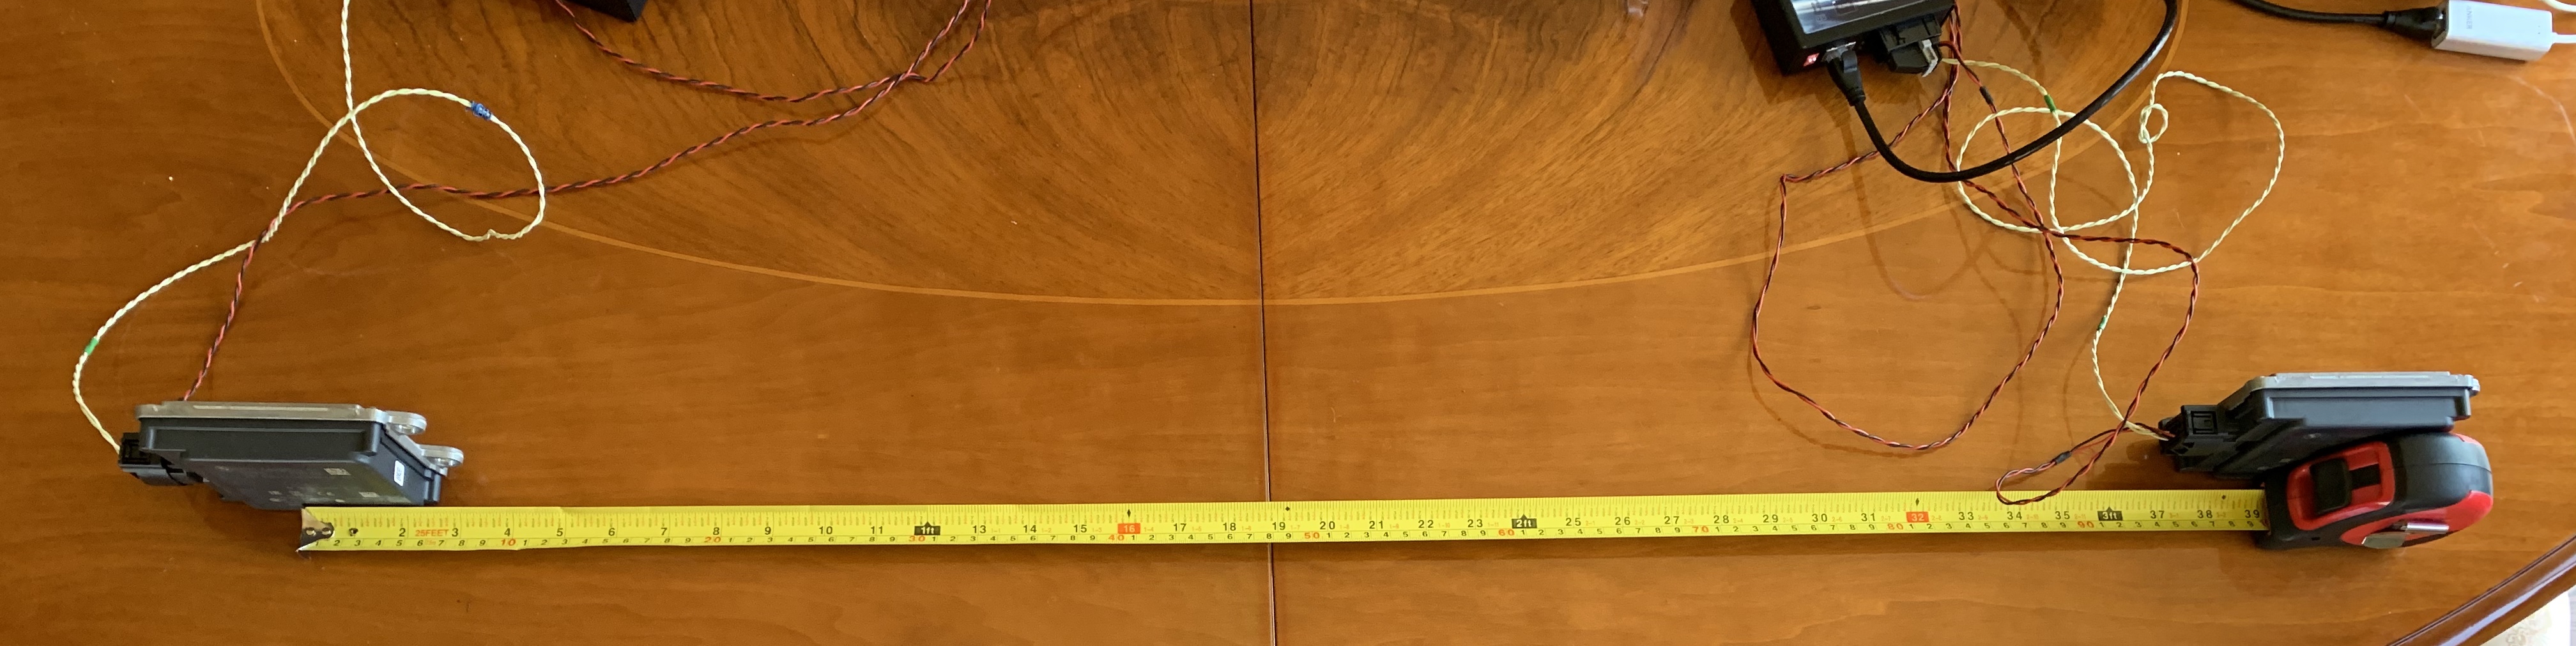
The next step in setting up the radars once all the wiring is finished is to set up the offset for the radars. In the picture below, the radars are one metre apart and are measured from the middle of the radars. Make sure they are level or aligned with each other.
[ {.confluence-embedded-image
height=”250”}]{.confluence-embedded-file-wrapper
.confluence-embedded-manual-size}
{.confluence-embedded-image
height=”250”}]{.confluence-embedded-file-wrapper
.confluence-embedded-manual-size}
The offsets can be found in the all_radar.launch file:
Offsets for the radars
 <node pkg="tf" type="static_transform_publisher" name="radar_right_tf" args="0 -0.5 0 0 0 0 base_link radar_right_frame 100" />

 <node pkg="tf" type="static_transform_publisher" name="radar_left_tf" args="0 0.5 0 0 0 0 base_link radar_left_frame 100" />
Currently the total distance between the radars is one metre as defined in the launch file. The offset helps separate point-cloud data and having the physical offset will make the point-cloud transforms and data more accurate as we have defined them in the radar transforms.
Finally, the last step is to turn on the power supply and the physical set-up for the multi-radar is done now.
Network Configurations
Adapter Configuration
[]{.aui-icon .aui-icon-small .aui-iconfont-warning .confluence-information-macro-icon}
If you do not have an Ethernet port, configure your Ethernet adapter first before doing this step.
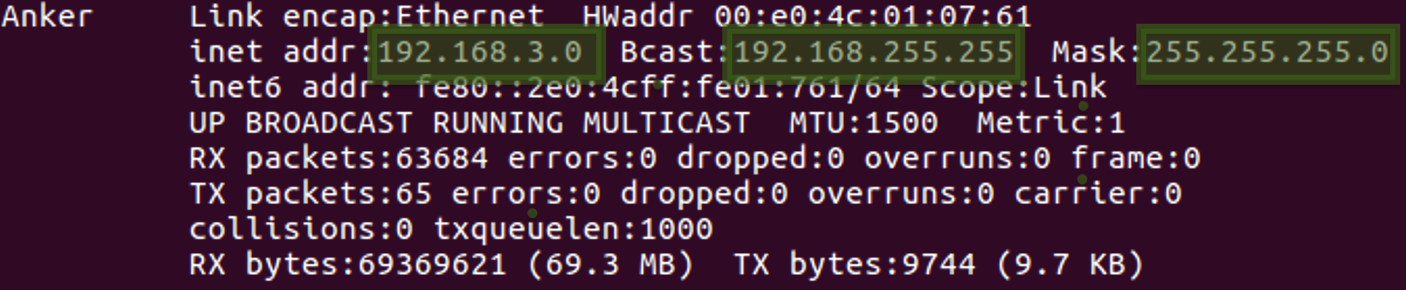
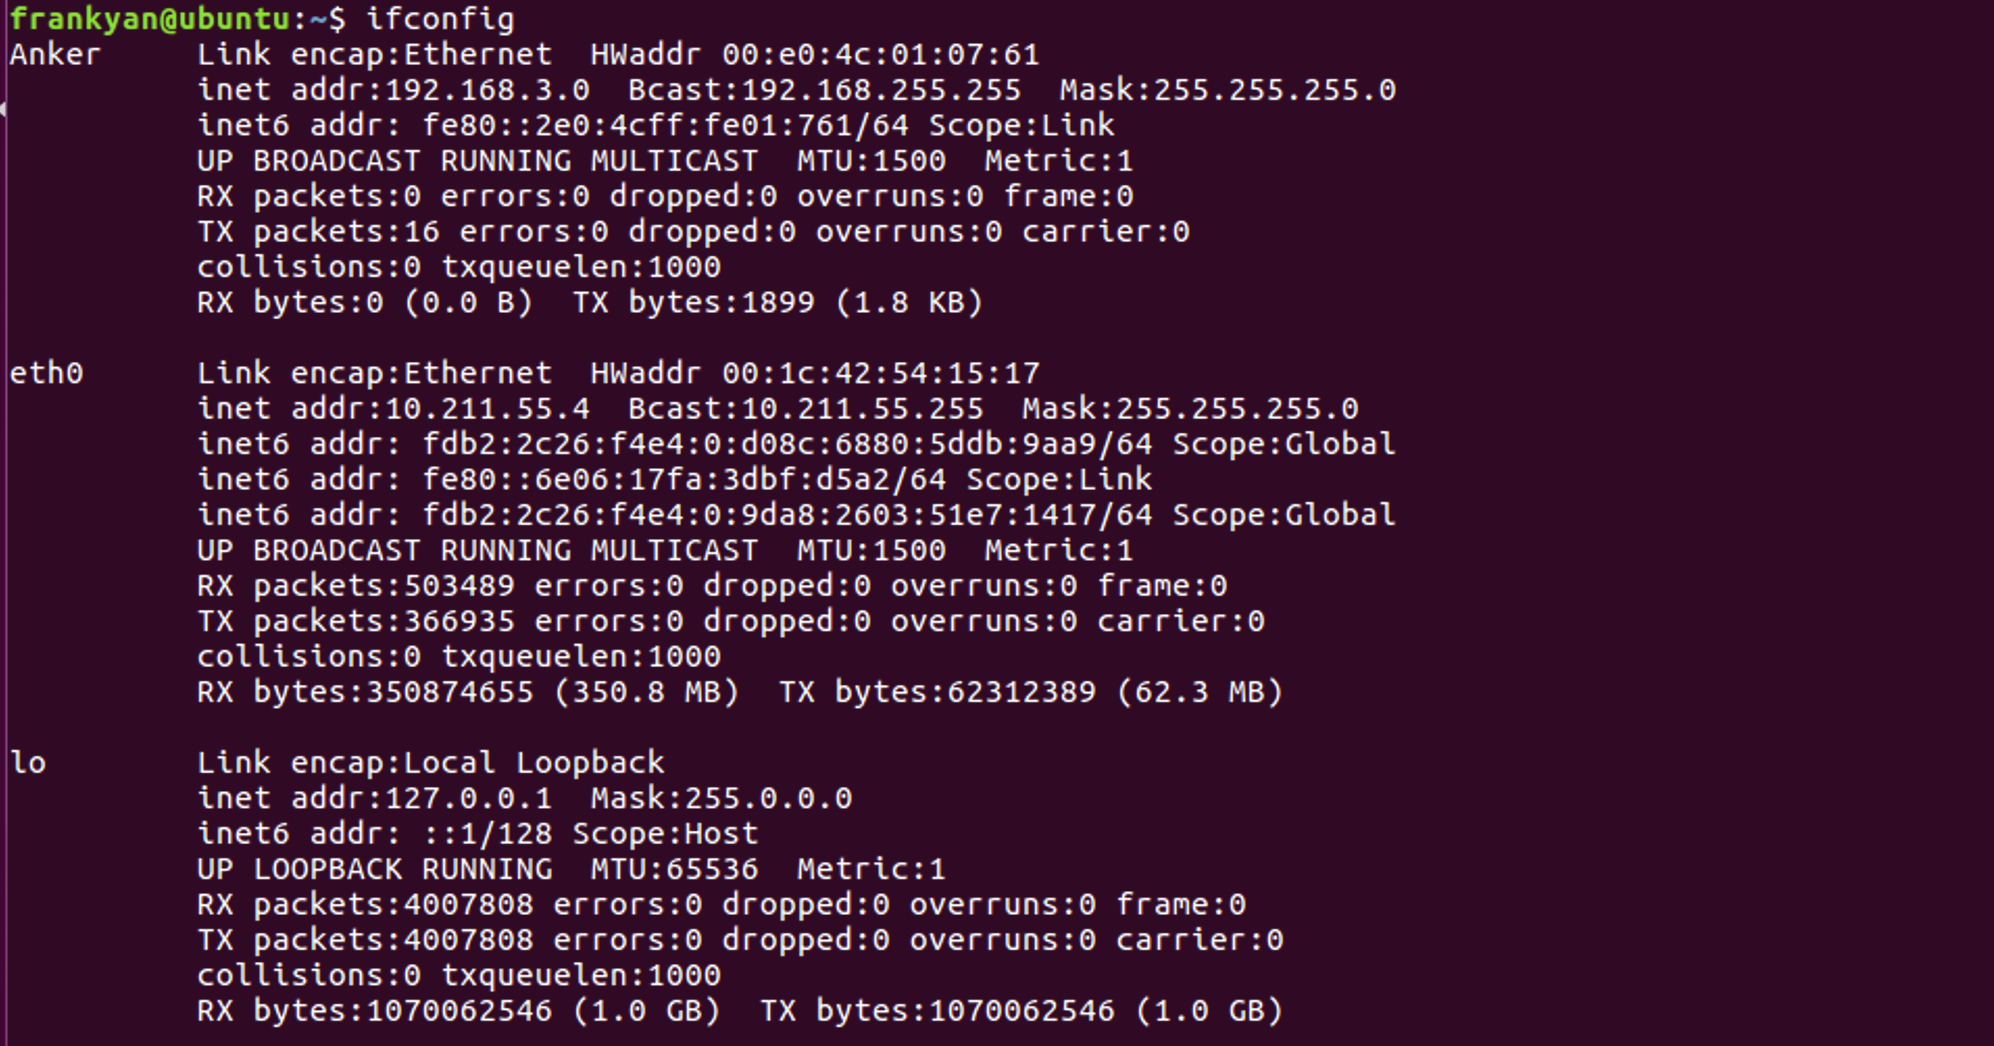
If this is your first time setting up the multi-radar, you will have to configure the right radar using the changing port script. The right radar needs to be configured because the radar's default port number is 31122 and we need to change it to 31121 and it is also a good idea to change the IP address of the right radar to avoid confusion with the left radar. Unplug the left radar cable from the switch to prevent the script from changing both the left and right radars. Running ifconfig gives the range of IP addresses you can configure the right radar's IP address to. In this example the network "Anker" is the network that is configured with the radars:
[ {.confluence-embedded-image
height=”150”}]{.confluence-embedded-file-wrapper
.confluence-embedded-manual-size}
{.confluence-embedded-image
height=”150”}]{.confluence-embedded-file-wrapper
.confluence-embedded-manual-size}
If you're not 100% familiar with the terms such as broadcast or mask, just know that in this example you can configure the right radar's IP address to any address between 192.168.0.0 to 192.168.255.254. 192.168.1.2, is the address of the left radar (don't change the IP address of the right radar to this, it will be confusing), and the addresses 192.168.3.0 and 192.168.255.255 are reserved.
IP Range
[]{.aui-icon .aui-icon-small .aui-iconfont-info .confluence-information-macro-icon}
(I'm not sure how the range works since the range should be 192.168.3.0 to 192.168.3.255 if the net mask is 255.255.255.0, unless it's class-ful networking and not CIDR).
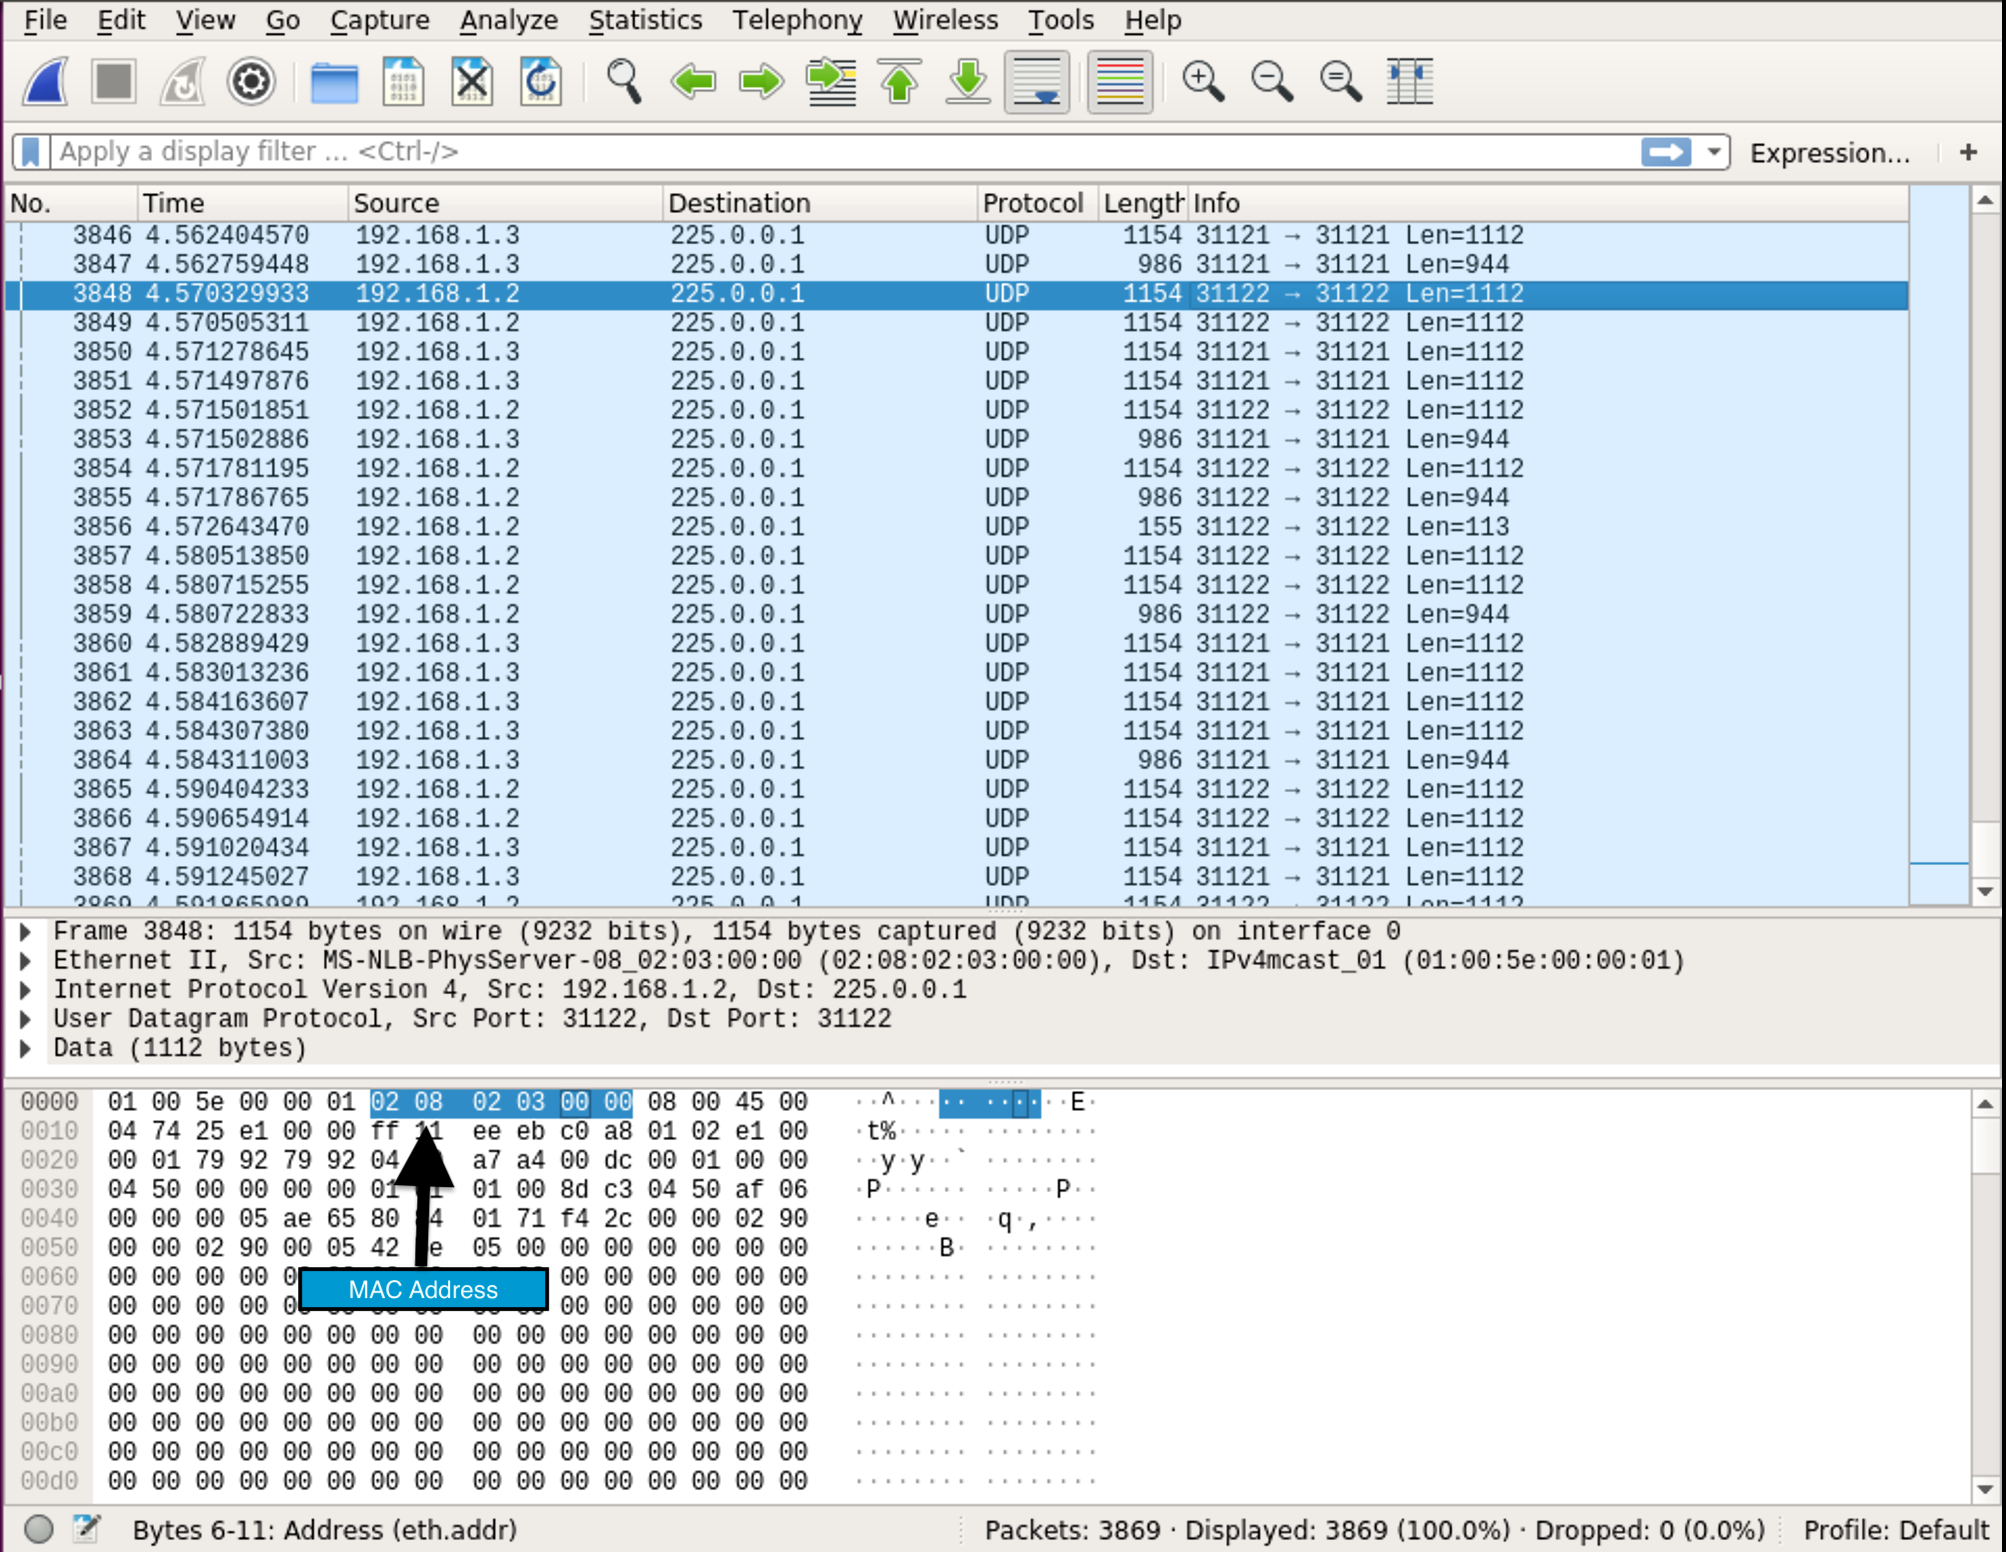
Open Wireshark and listen to the network interface that has the radars.
[ {.confluence-embedded-image
height=”400”}]{.confluence-embedded-file-wrapper
.confluence-embedded-manual-size}
{.confluence-embedded-image
height=”400”}]{.confluence-embedded-file-wrapper
.confluence-embedded-manual-size}
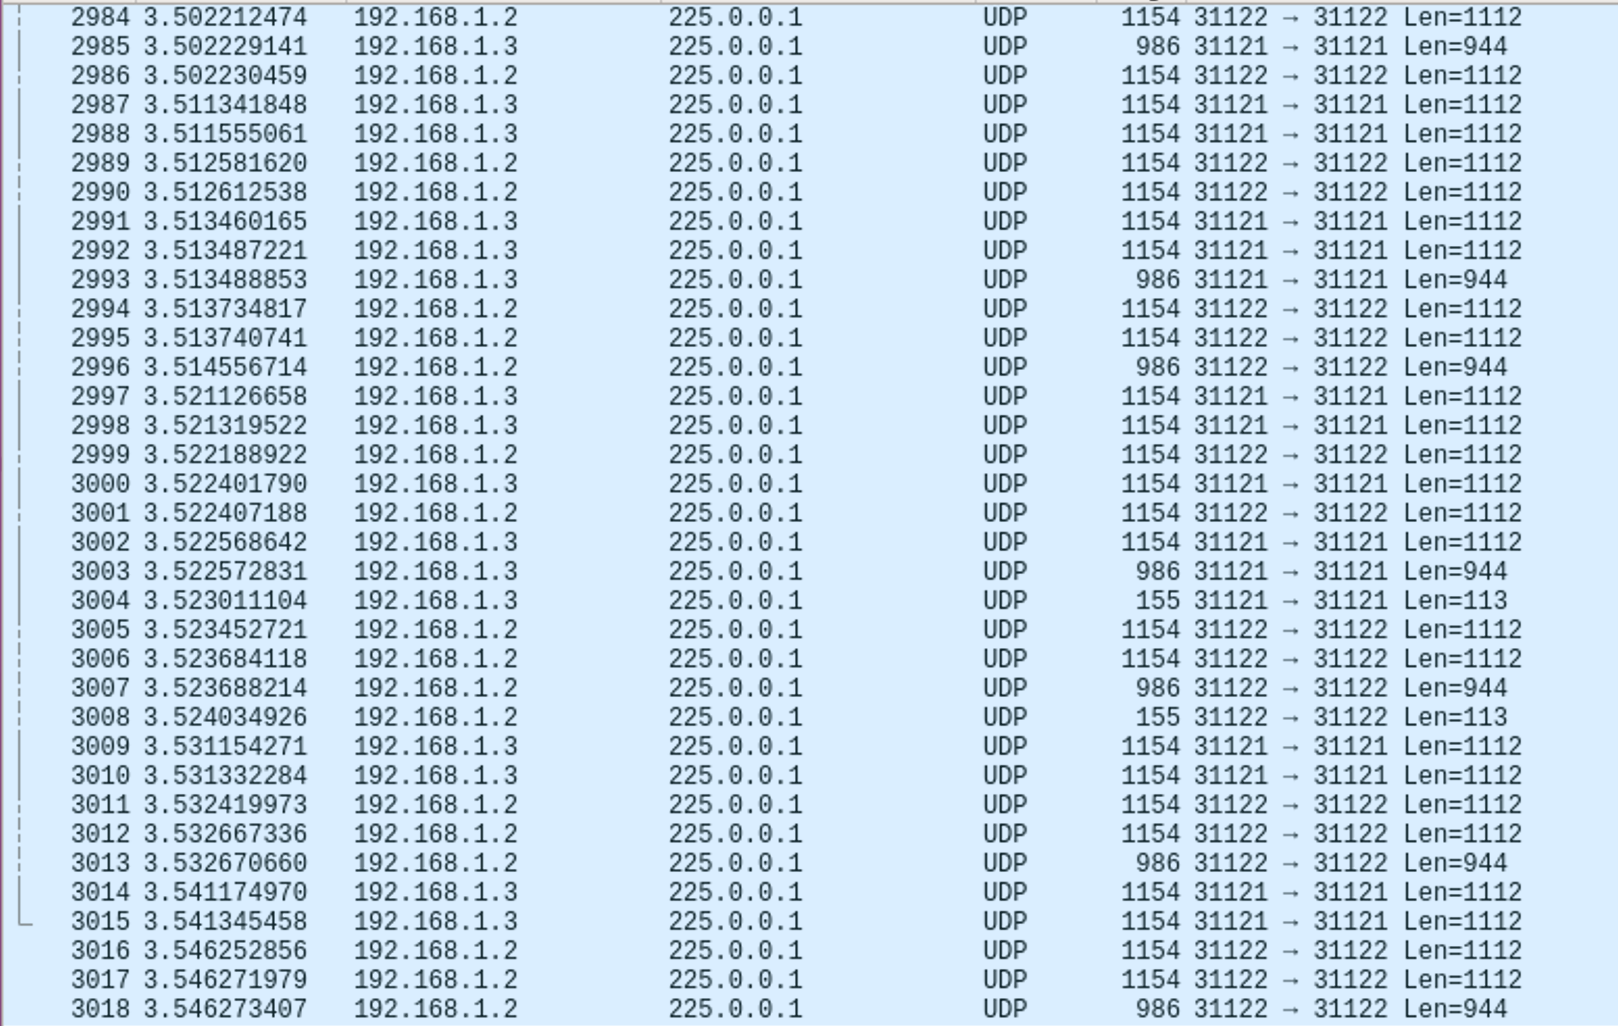
Under the source column that will show you the IP address of the device. You will need this for the script command. Another important piece of information you need for the script is the MAC address of the radar. In the above picture the MAC address is highlighted and has the format XX:XX:XX:XX:XX:XX where XX is in hex. If you don't know what a MAC address is, it's the unique address of the device that is given by the manufacturer and is generally hardcoded on the device.
Once you have found the MAC address and the IP address of the radar use all this information and follow the changing port script to change the IP address and port number of the right radar. If the script succeeds, plug the left radar's cable back into the switch. Changing the MAC address of the right radar is optional.
Check Wireshark again and if you see two different port numbers and two different IPs, then everything is working well.
[ {.confluence-embedded-image
height=”400”}]{.confluence-embedded-file-wrapper
.confluence-embedded-manual-size}
{.confluence-embedded-image
height=”400”}]{.confluence-embedded-file-wrapper
.confluence-embedded-manual-size}
Assuming you have already configured your adapter or have an Ethernet port on your computer, the last thing to change is the interface name in the all_radar.launch file:
<arg name="iface" value="interface_name"/>
So if the name of my interface is "Anker", I would change the "iface" value to "Anker".
Now everything should be set up and you can now follow the instructions to run the live multi-radar in the README.md file.
That should be all of the steps needed to set up the multi-radar. If they are any missing steps or clarification needed, feel free to add in the appropriate information. If you have any questions or are having issues, feel free to ask the radar_driver group on Discord.
Debugging Tips
If you cannot see any radar points in rviz, check the following:
- In
all_radar.launch, is theifaceargument right? - If you are running ROS noetic, you might need to change
-std=c++11to-std=c++14in CMakeLists.txt - launching
all_radar.launchmay not show errors, try running a single radar,rosrun radar_driver radar_publisher -e enp0s25 -p 31122 -c 1you will need to change the arguments accordingly and runroscorein another terminal - If there are permission errors,
sudo setcap 'cap_net_raw=pe' devel/lib/radar_driver/radar_publishermight work - If there are “libxmlrpcpp not found” errors, go into
sudo suto run the commands instead ofsudo setcap - If there is a no IPv4 address assigned warning, comment out line 53-58 in sniffer.cpp
if pcap_lookupnetblock
It is very common for networking to go wrong. You can use wire-sniffer programs like Wireshark or Tcpdump to help with networking issues. To isolate the radar packets you must know the relevant network interface. To test this run 'ifconfig'. This should show a list of connected interfaces like so:
[ {.confluence-embedded-image
height=”250”}]{.confluence-embedded-file-wrapper
.confluence-embedded-manual-size}
{.confluence-embedded-image
height=”250”}]{.confluence-embedded-file-wrapper
.confluence-embedded-manual-size}
If the radar is directly connected to the computer, choose the one that matches the above IP address in the 'inet addr' field. If it is through a switch try testing different ones that start with 'e', for ethernet (I'm not too sure how to isolate the correct one).
To use Tcpdump run,
TCPDUMP example
$ tcpdump -i enp2s0 udp
[This assumed enp2s0 was the relevant interface. This should rapidly print a list of packets as they come in at a high frequency.]
TCPdump issue
[]{.aui-icon .aui-icon-small .aui-iconfont-approve .confluence-information-macro-icon}
If tcpdump does not work and gives you a permission error, just use wireshark instead.
To run Wireshark, type in
Wireshark command
$ sudo wireshark
You will be taken to a large list with a bunch of interfaces that are detected by your computer. Click on the interface you have for the radars and you will see the radar packets coming in. To learn more about Wireshark, check their website: https://www.wireshark.org/.
The packet sniffer was implemented using libpcap, the same backend library used by tcpdump to capture packets. Processing the data is currently in development.
Document generated by Confluence on Nov 28, 2021 22:40